Chapter 5 Molecular Data Analysis
For each function, we will introduce its basic use and example output. Users can check all analysis or visualization parameters available by clicking the corresponding title link.
Among most functions, their first parameter is molecular identifier of one data type. Users can also design a molecular signature comprised of multiple molecules (e.g.
TP53 + 2 * KRAS - 1.3 * PTEN).Users can also modify alternative datasets if available for one molecular type through the
opt_pancanparameter. (see more viastr(.opt_pancan))
5.1 TCGA analysis
| Database | Type | Function |
|---|---|---|
| TCGA | Comparison | vis_toil_TvsN() |
| TCGA | Comparison | vis_toil_TvsN_cancer() |
| TCGA | Comparison | vis_pancan_anatomy() |
| TCGA | Comparison | vis_toil_Mut() |
| TCGA | Comparison | vis_toil_Mut_cancer() |
| TCGA | Correlation | vis_gene_cor() |
| TCGA | Correlation | vis_gene_cor_cancer() |
| TCGA | Correlation | vis_gene_TIL_cor() |
| TCGA | Correlation | vis_gene_immune_cor() |
| TCGA | Correlation | vis_gene_tmb_cor() |
| TCGA | Correlation | vis_gene_msi_cor() |
| TCGA | Correlation | vis_gene_stemness_cor() |
| TCGA | Correlation | vis_gene_pw_cor() |
| TCGA | Survival | tcga_surv_plot() |
| TCGA | Survival | vis_unicox_tree() |
| TCGA | Dimension Reduction | vis_dim_dist() |
5.1.1 Comparison analysis
5.1.1.1 vis_toil_TvsN()
Compare molecular value between tumor and normal samples across pan-cancer. (Custom module)
- Basic use:
vis_toil_TvsN(Gene=, data_type=)
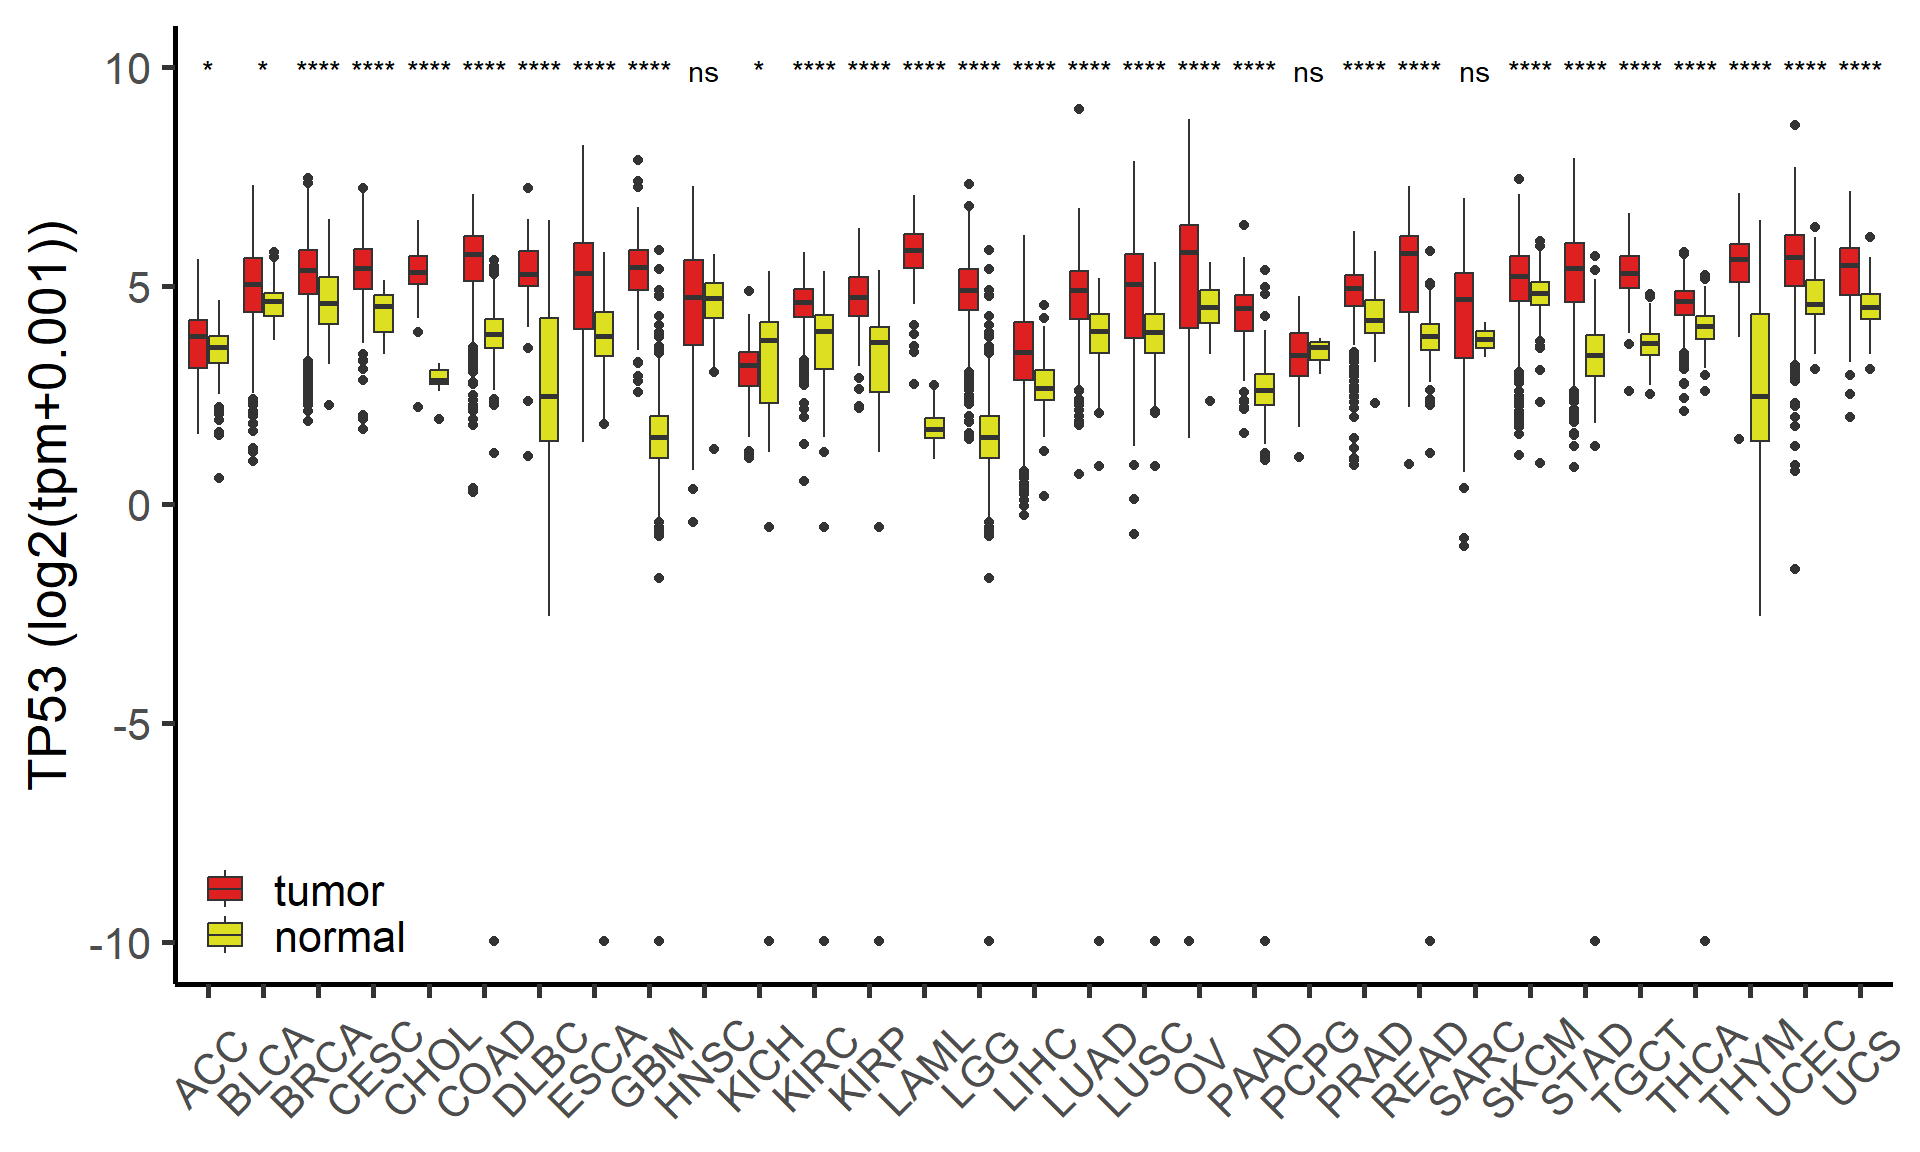
Figure 5.1: The difference of mRNA TP53 across pan-cancer
5.1.1.2 vis_toil_TvsN_cancer()
Compare molecular value between tumor and normal samples in one cancer. (Custom module)
- Basic use:
vis_toil_TvsN_cancer(Gene=, data_type=, Cancer=)
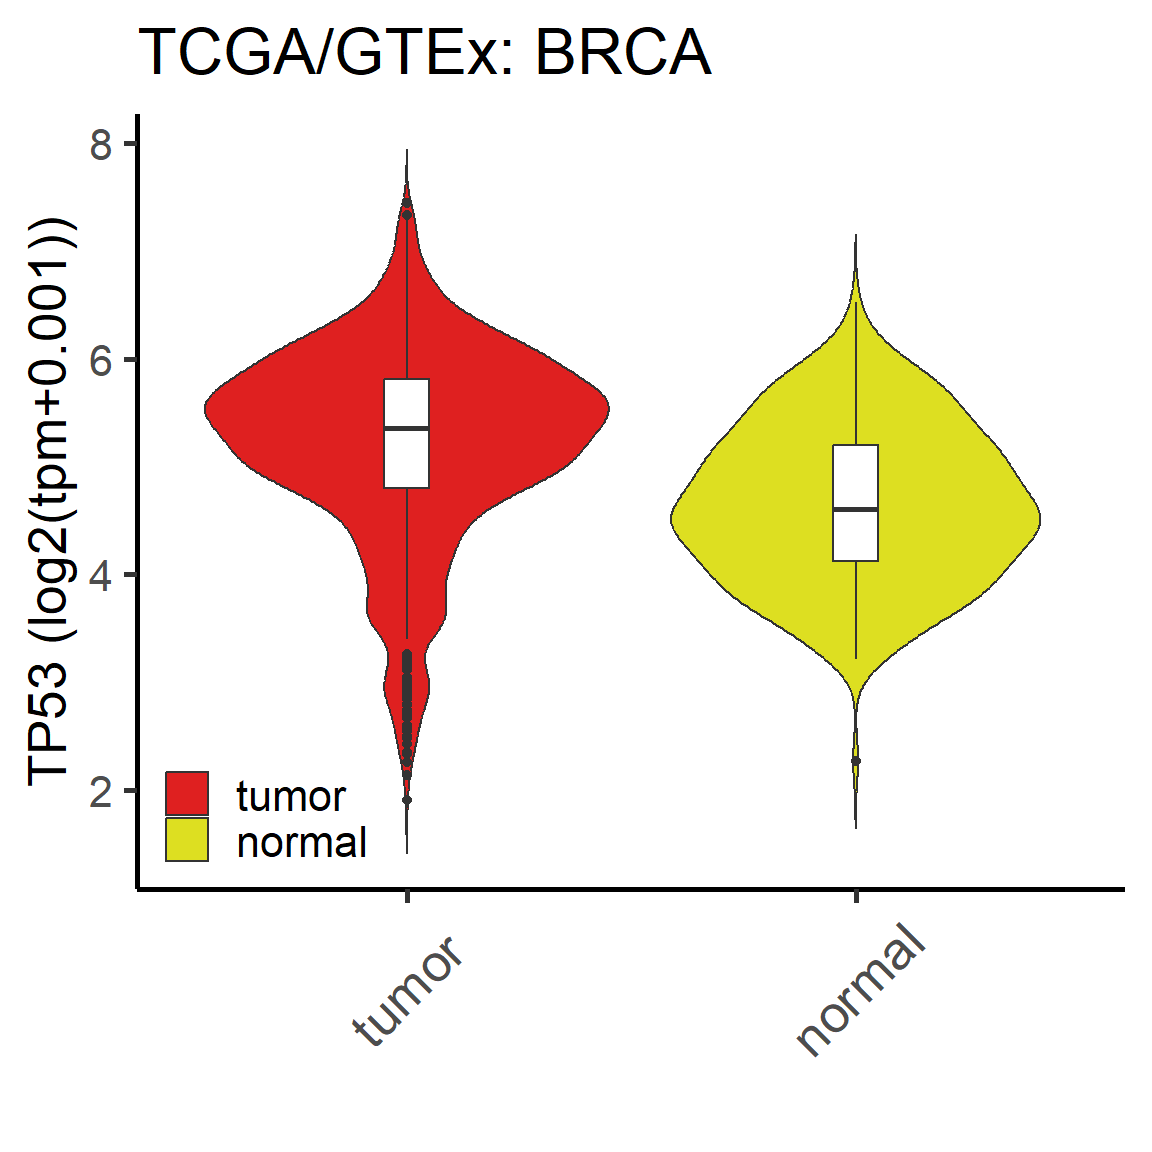
Figure 5.2: The difference of mRNA TP53 in ACC cancer
5.1.1.3 vis_pancan_anatomy()
- Basic use:
vis_pancan_anatomy(Gene="TP53", Gender=, data_type="mRNA")
## $plot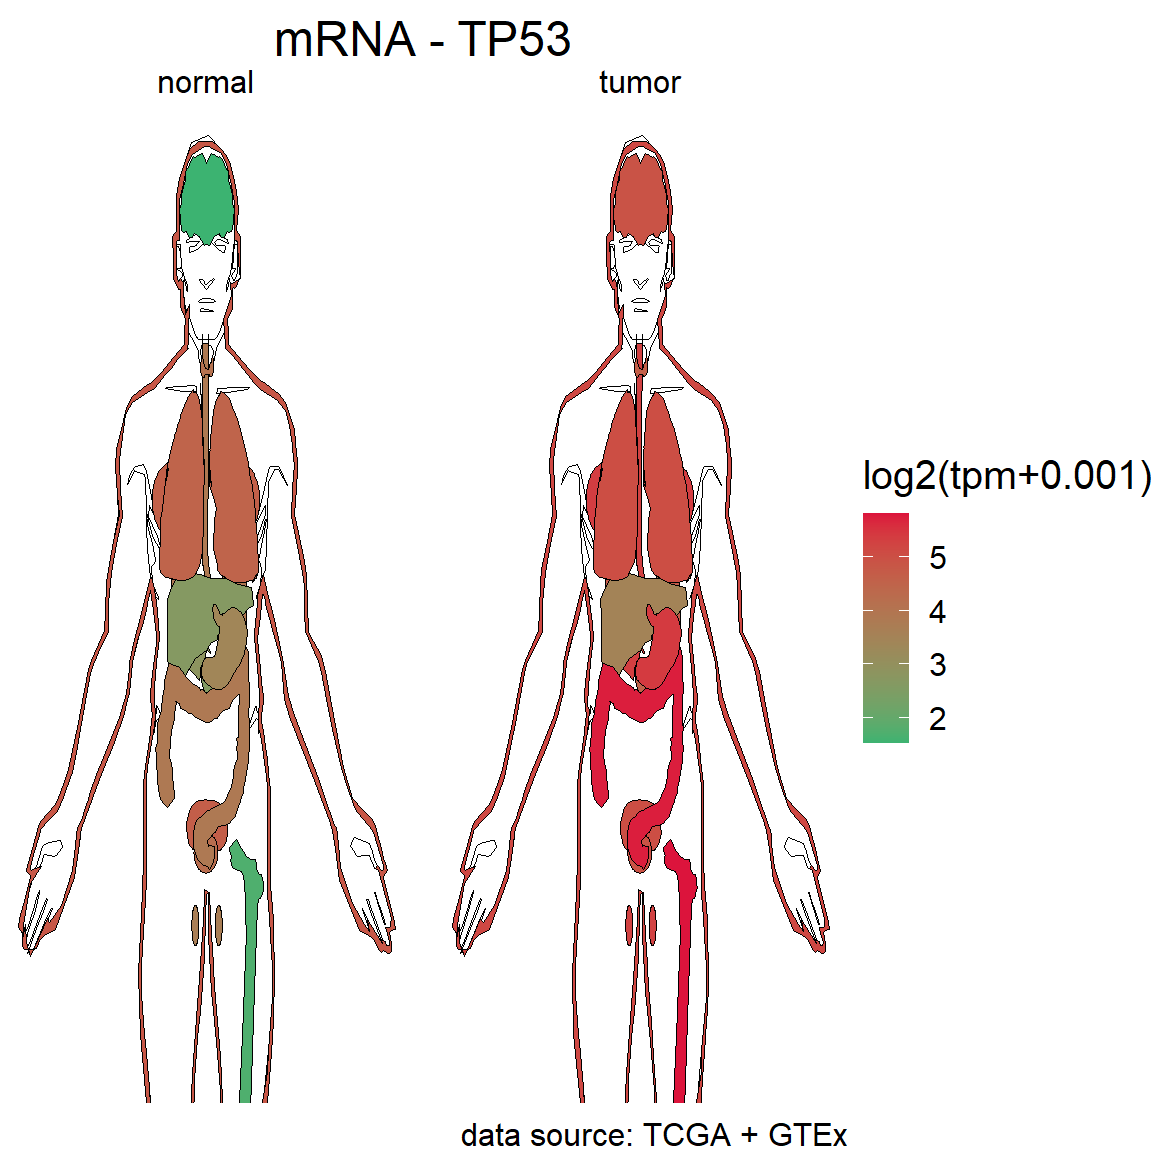
Figure 5.3: The difference of mRNA TP53 in Pan-cancer
##
## $data
## # A tibble: 57 × 8
##    group       Median tissue type.x           type   organ           color value
##    <chr>        <dbl> <chr>  <fct>            <fct>  <chr>           <chr> <dbl>
##  1 ACC_normal    3.60 ACC    ACC_normal_GTEx  normal adrenal_gland   #41a…  3.60
##  2 ACC_tumor     3.85 ACC    ACC_tumor_TCGA   tumor  adrenal_gland   #41a…  3.85
##  3 BLCA_normal   4.65 BLCA   BLCA_normal_TCGA normal urinary_bladder oran…  4.65
##  4 BLCA_normal   4.65 BLCA   BLCA_normal_GTEx normal urinary_bladder oran…  4.65
##  5 BLCA_tumor    5.04 BLCA   BLCA_tumor_TCGA  tumor  urinary_bladder oran…  5.04
##  6 BRCA_normal   4.61 BRCA   BRCA_normal_GTEx normal breast          #41a…  4.61
##  7 BRCA_normal   4.61 BRCA   BRCA_normal_TCGA normal breast          #41a…  4.61
##  8 BRCA_tumor    5.36 BRCA   BRCA_tumor_TCGA  tumor  breast          #41a…  5.36
##  9 CHOL_normal   2.84 CHOL   CHOL_normal_TCGA normal gall_bladder    oran…  2.84
## 10 CHOL_tumor    5.31 CHOL   CHOL_tumor_TCGA  tumor  gall_bladder    oran…  5.31
## # ℹ 47 more rows
5.1.1.4 vis_toil_Mut()
Compare molecular value between mutation and wild tumor samples across pan-cancer. (Custom module)
- Basic use:
vis_toil_Mut(mut_Gene=, Gene=, data_type=)
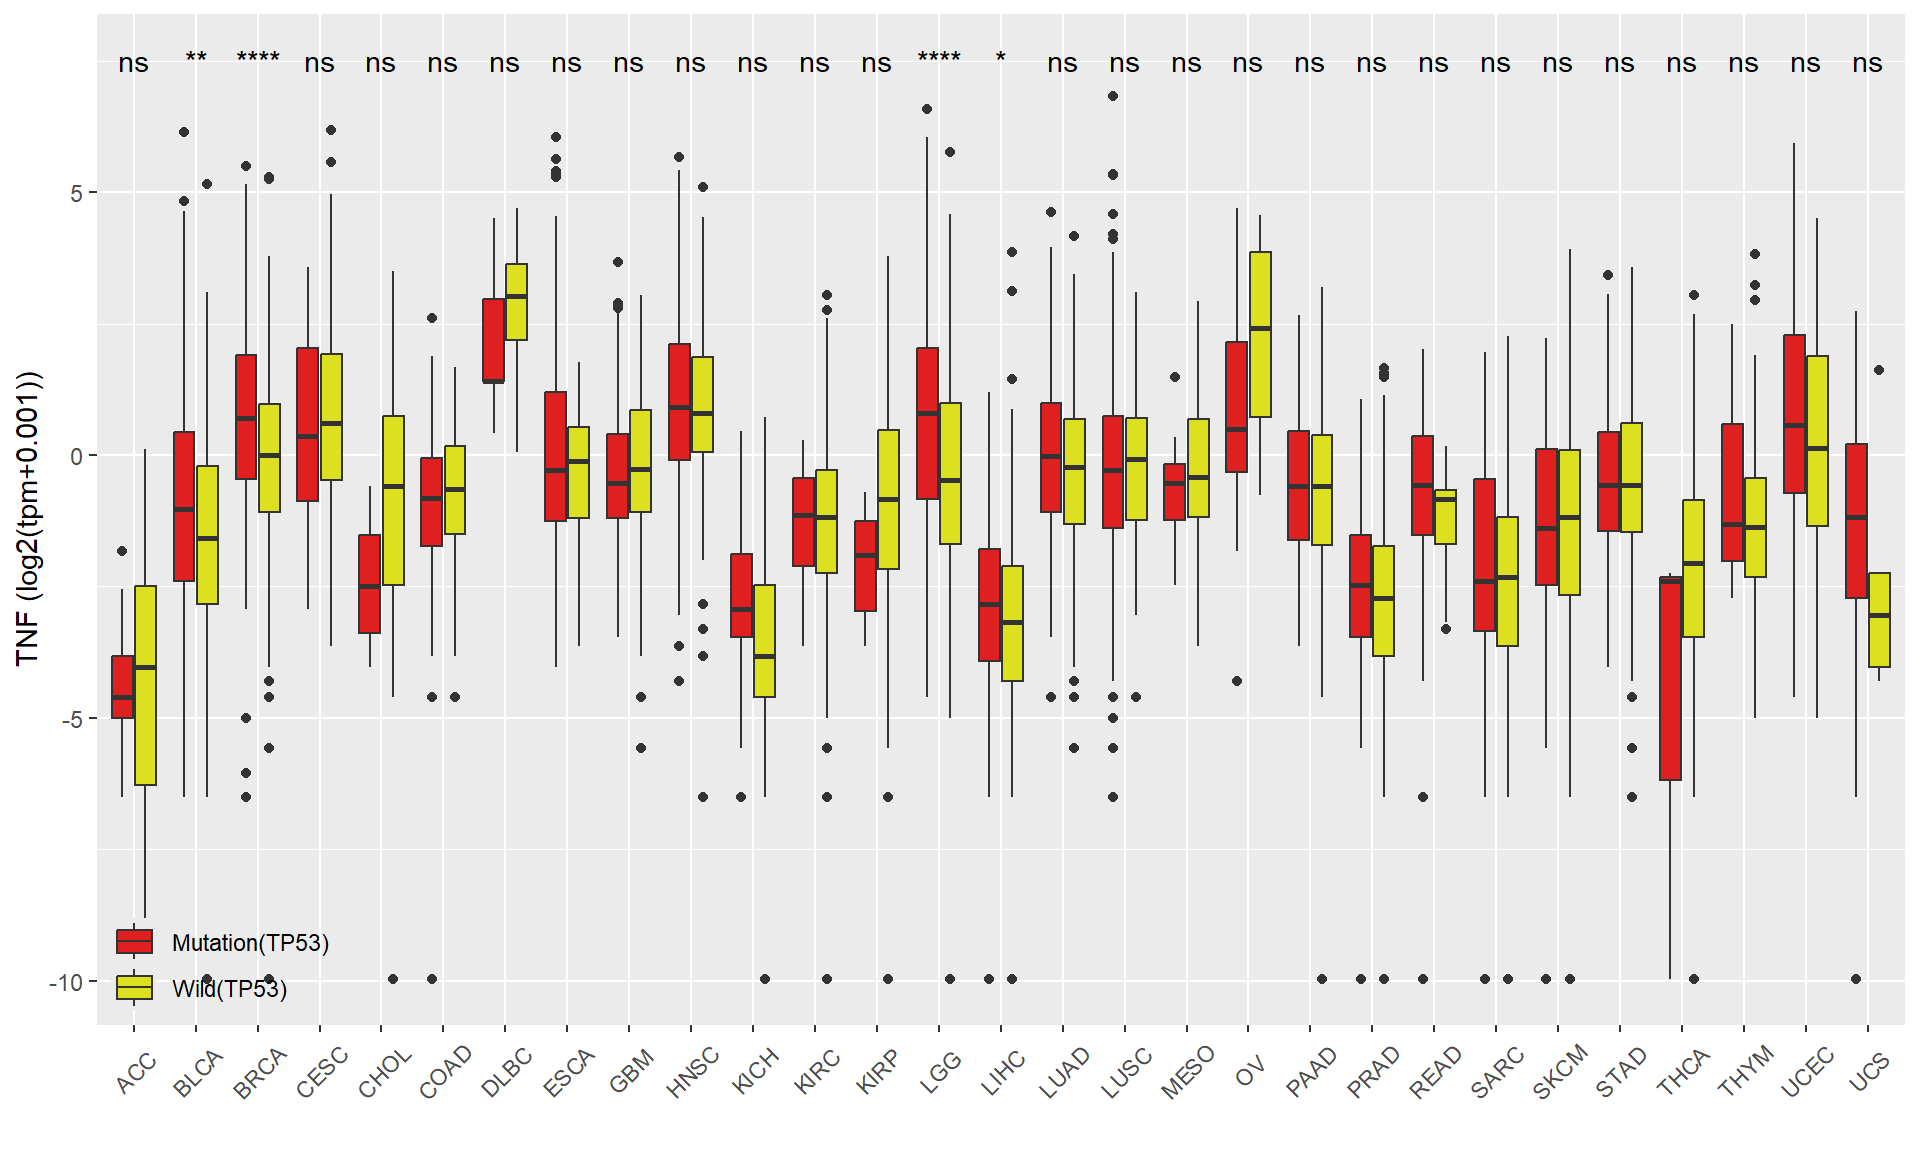
Figure 5.4: The difference of mRNA TNF between TP53-mut and TP53-wild tumor samples across pan-cancer
5.1.1.5 vis_toil_Mut_cancer()
Compare molecular value between mutation and wild tumor samples in one cancer. (Custom module)
- Basic use:
vis_toil_Mut_cancer(Gene=, data_type=, Cancer=)
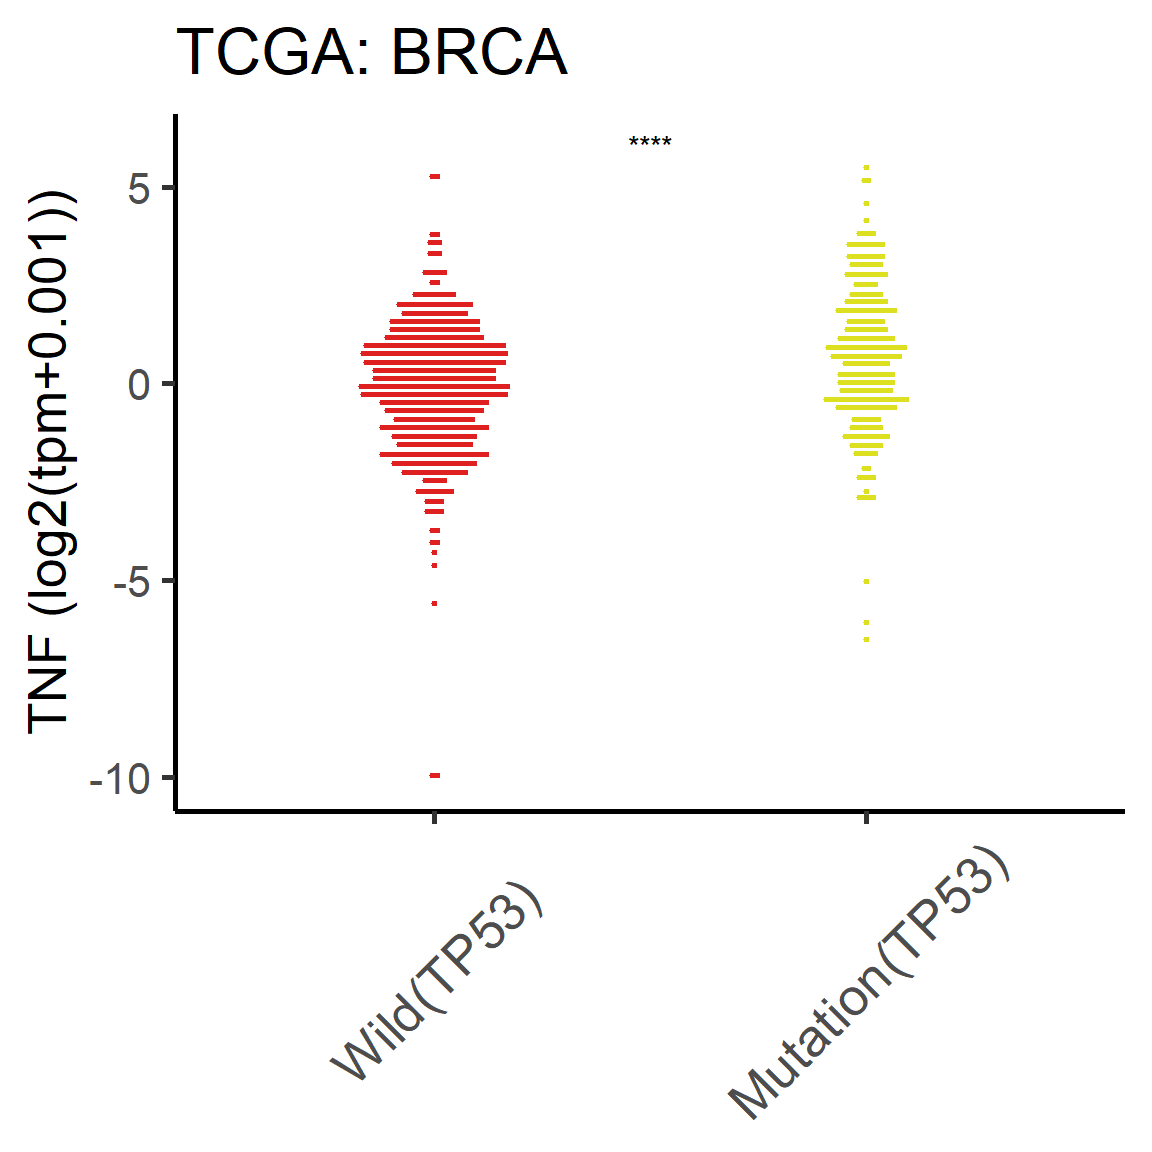
Figure 5.5: The difference of mRNA TNF between TP53-mut and TP53-wild tumor samples in BRCA cancer
5.1.2 Correlation analysis
5.1.2.1 vis_gene_cor()
Calculate the correlation between two molecules value in tumor samples of pan-cancers. (Custom module)
- Basic use:
vis_gene_cor(Gene1=, data_type1=, Gene2=, data_type2=)
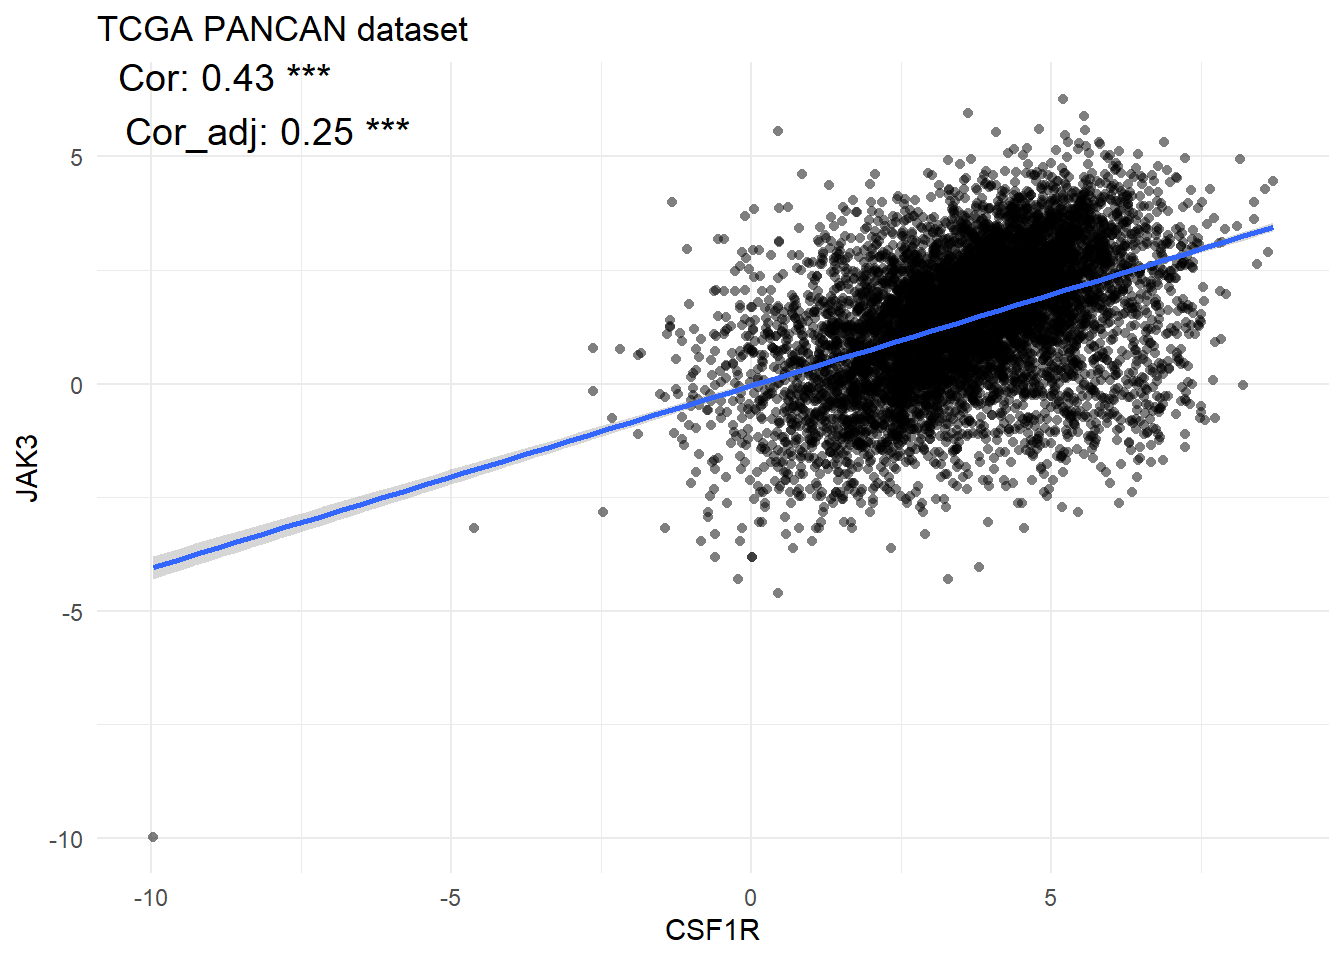
Figure 5.6: The correlation between mRNA CSF1R and mRNA JAK3 in tumor samples of pan-cancers
5.1.2.2 vis_gene_cor_cancer()
Calculate the correlation between two molecules value in tumor samples of one cancer. (Custom module)
- Basic use:
vis_gene_cor_cancer(Gene1=, data_type1=, Gene2=, data_type2=, cancer_choose=)
vis_gene_cor_cancer(Gene1 = "CSF1R", data_type1 = "mRNA",
                    Gene2 = "JAK3", data_type2 = "mRNA",
                    cancer_choose = "ACC")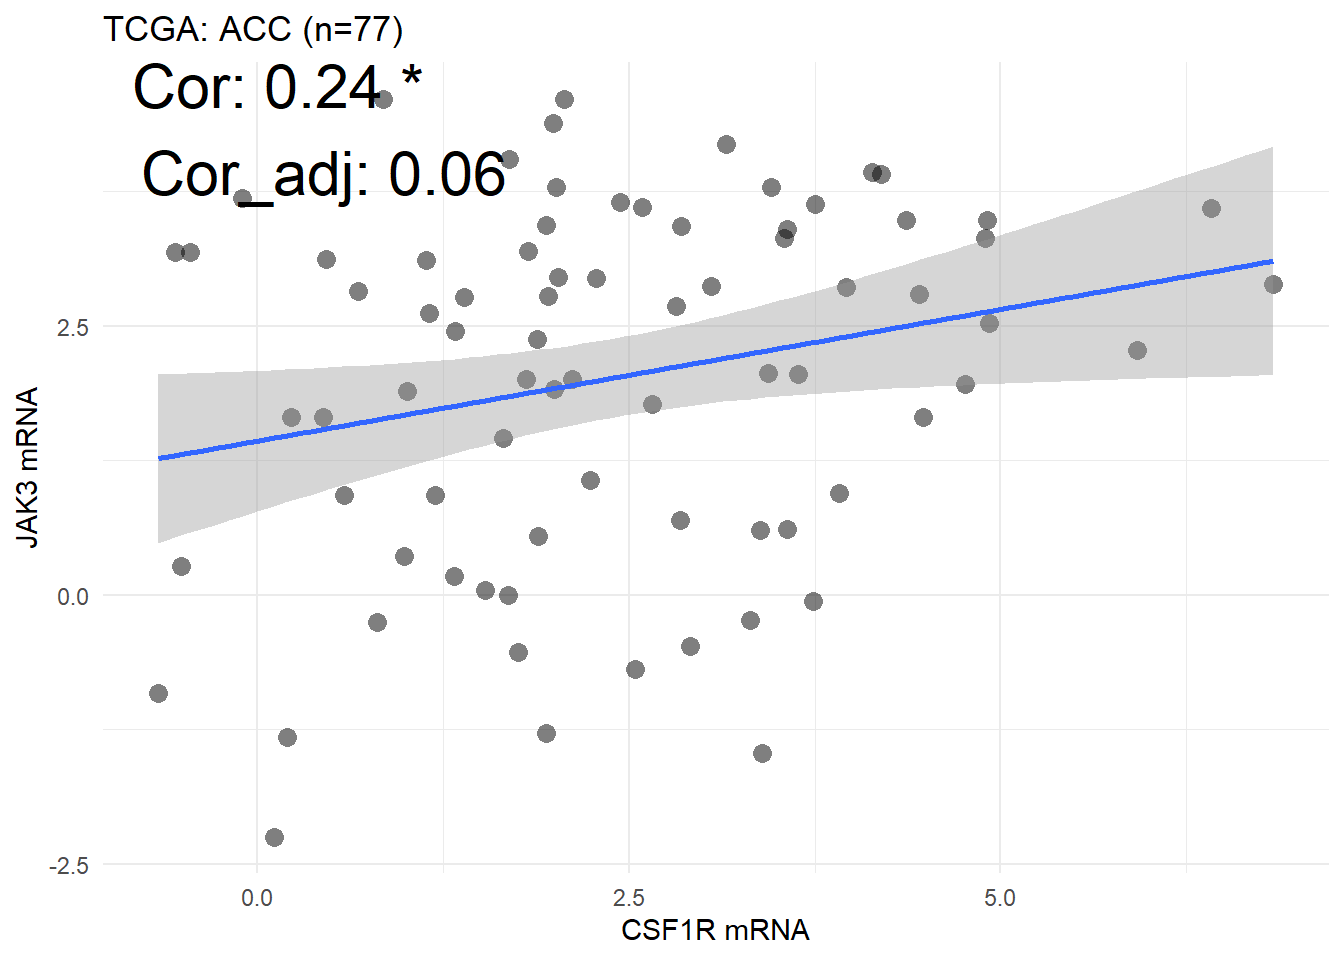
Figure 5.7: The correlation between mRNA CSF1R and mRNA JAK3 in tumor samples of ACC cancer
5.1.2.3 vis_gene_TIL_cor()
Calculate the correlation between one molecule and one type of TIL in tumor samples across pan-cancers. (Custom module)
- Basic use:
vis_gene_TIL_cor(Gene= ,data_type= ,sig=)
## [1] "CIBERSORT"     "CIBERSORT-ABS" "EPIC"          "MCPCOUNTER"
## [5] "QUANTISEQ"     "TIMER"         "XCELL"
sig = paste(tcga_ids$id_TIL$TIMER$Level3,
tcga_ids$id_TIL$TIMER$Level2, sep = "_")
vis_gene_TIL_cor(Gene = "TP53", data_type = "mRNA",
sig = sig)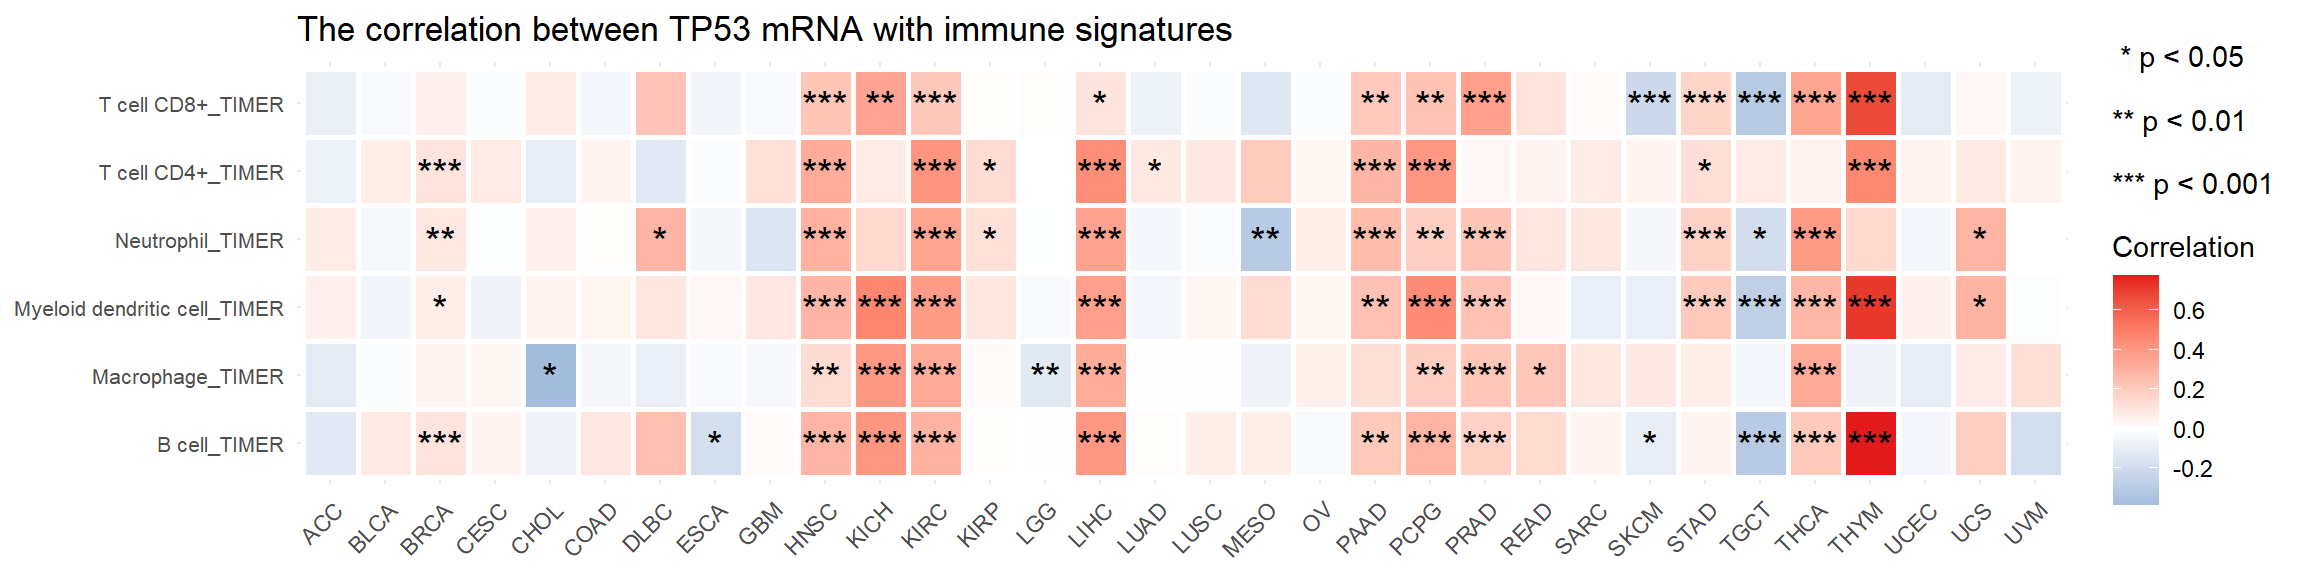
Figure 5.8: The correlation between mRNA TP53 and TIMER TIL in tumor samples across pan-cancers
5.1.2.4 vis_gene_immune_cor()
Calculate the correlation between one molecule and one type of Immune signature in tumor samples across pan-cancers. (Custom module)
- Basic use:
vis_gene_immune_cor(Gene= ,data_type= ,sig=)
tcga_pan_immune_signature <- load_data("tcga_pan_immune_signature")
table(tcga_pan_immune_signature$Source)
##
## Attractors Bindea c7atoms Cibersort ICR Wolf Yasin
## 9 25 32 20 3 68 3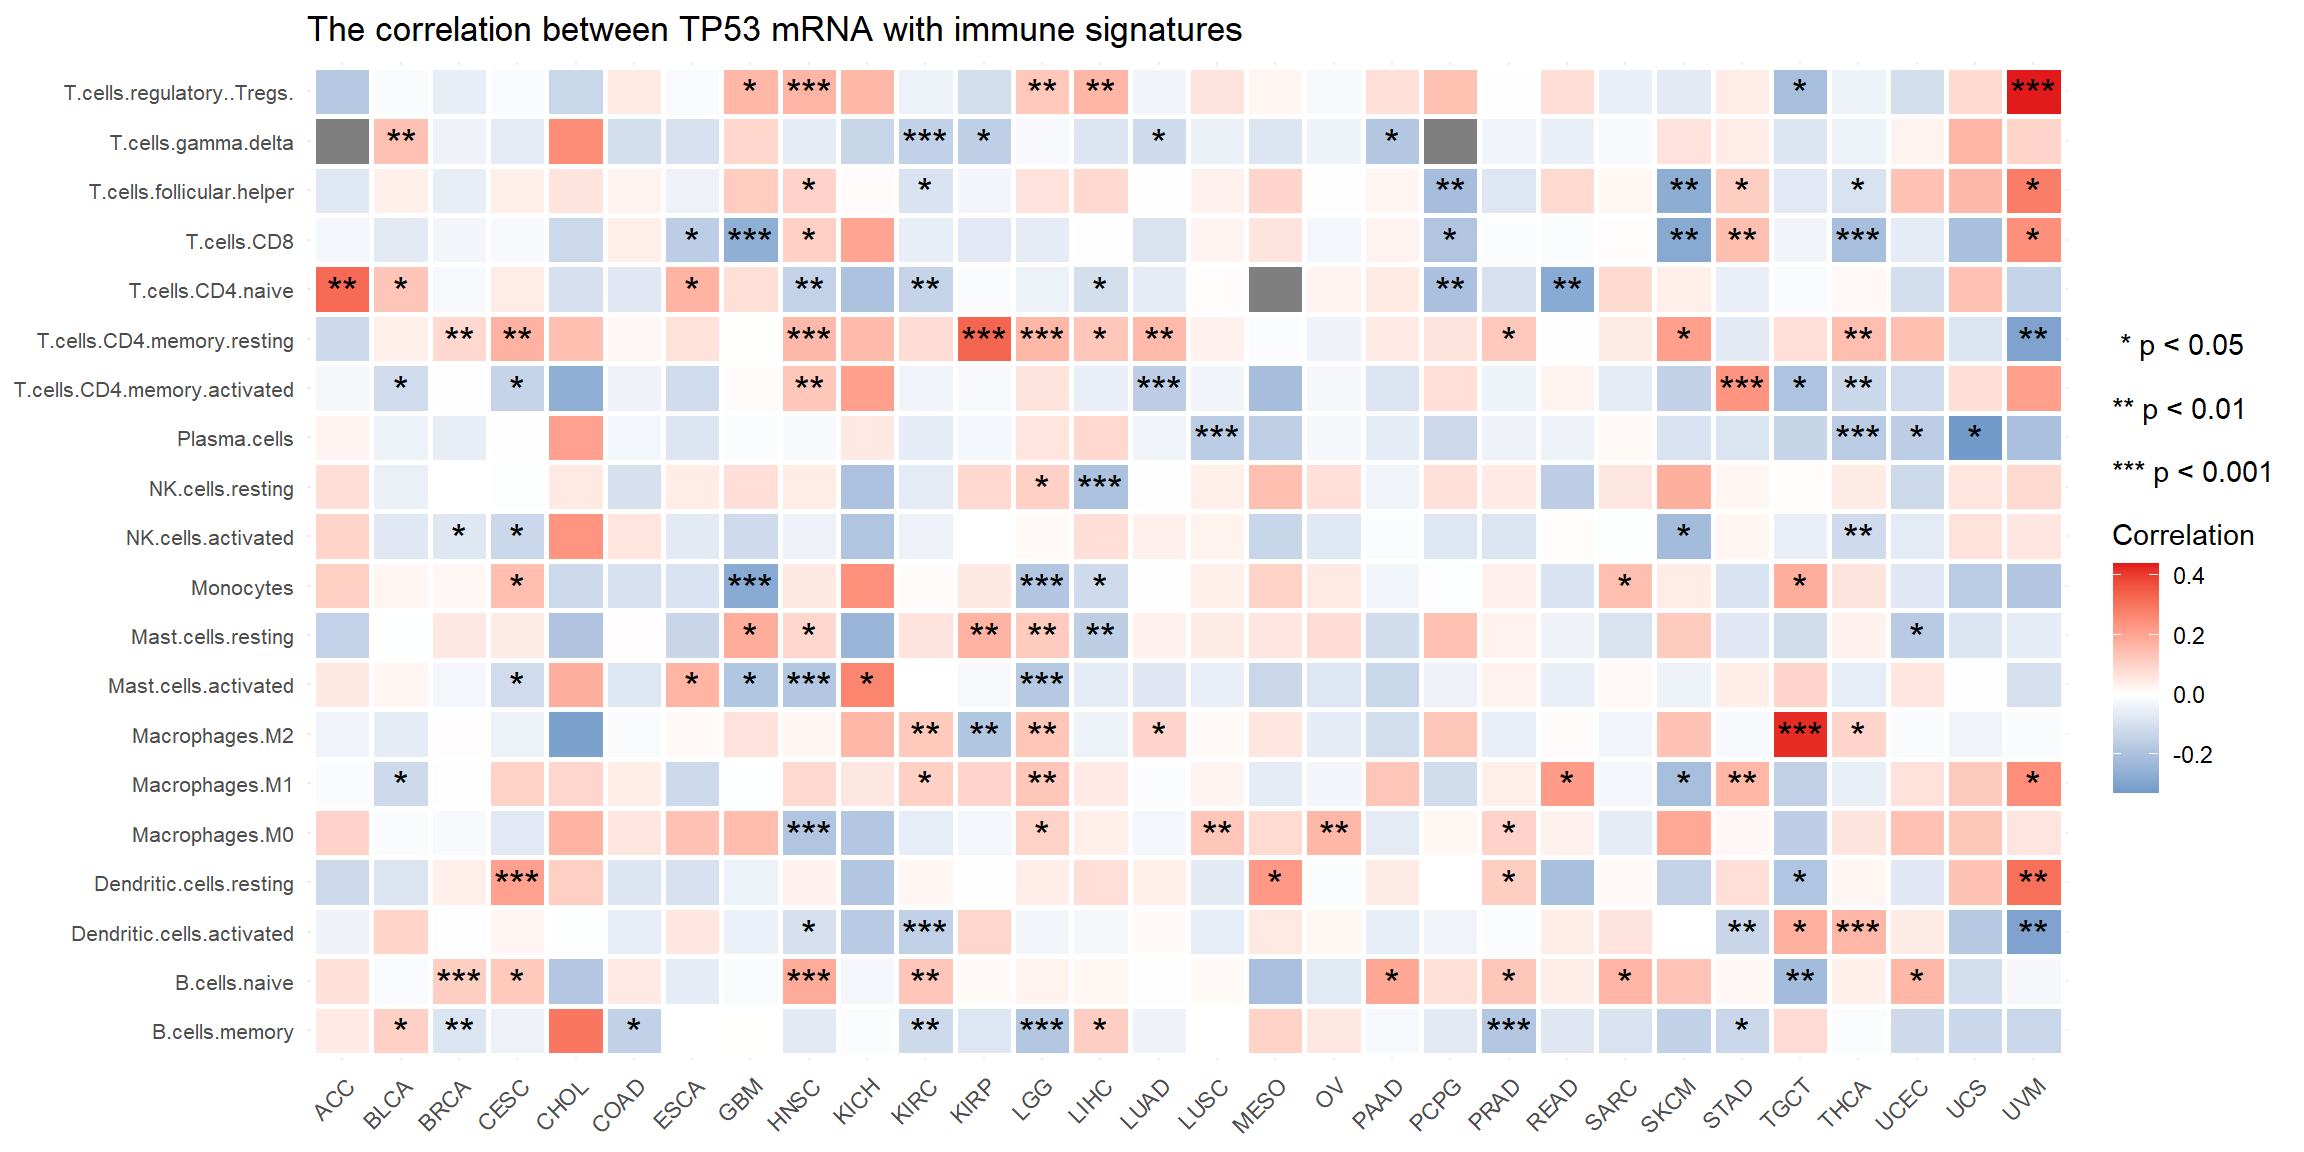
Figure 5.9: The correlation between mRNA TP53 and Cibersort signature in tumor samples across pan-cancers
5.1.2.5 vis_gene_tmb_cor()
Calculate the correlation between one molecule and TMB score in tumor samples across pan-cancers. (Custom module)
- Basic use:
vis_gene_tmb_cor(Gene= , data_type= )
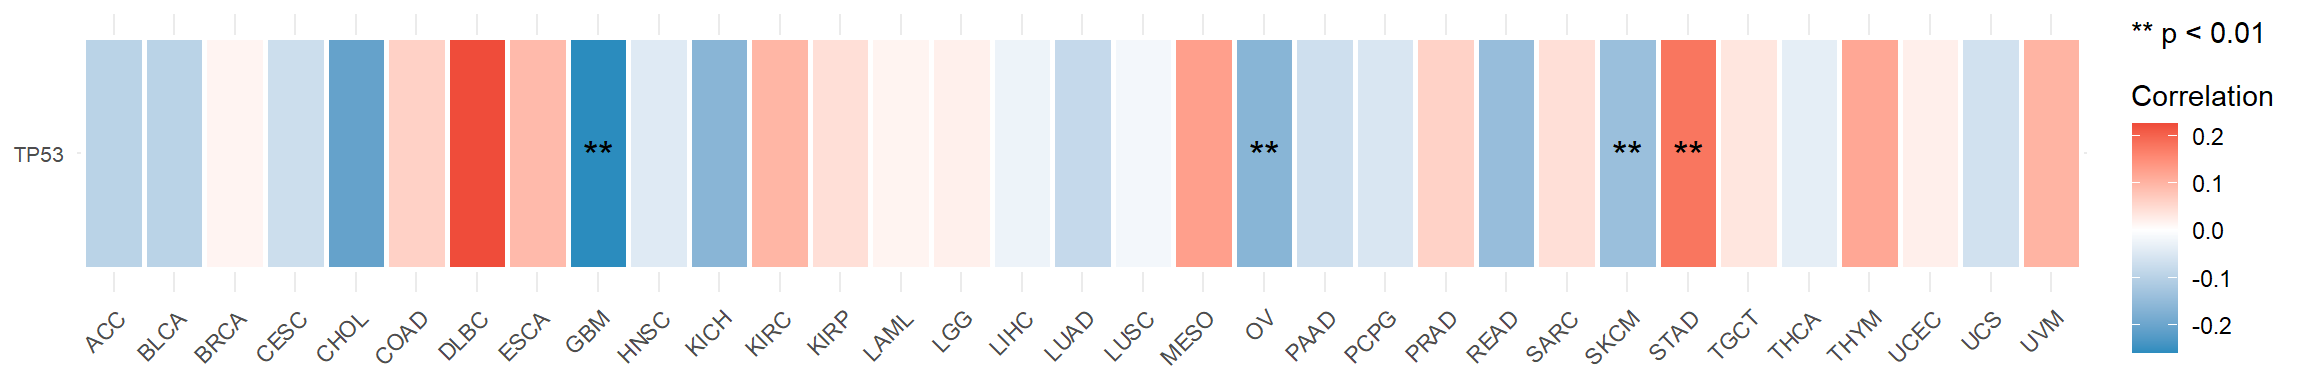
Figure 5.10: The correlation between mRNA TP53 and TMB score in tumor samples across pan-cancers
5.1.2.6 vis_gene_msi_cor()
Calculate the correlation between one molecule and MSI score in tumor samples across pan-cancers. (Custom module)
- Basic use:
vis_gene_msi_cor(Gene= , data_type= )
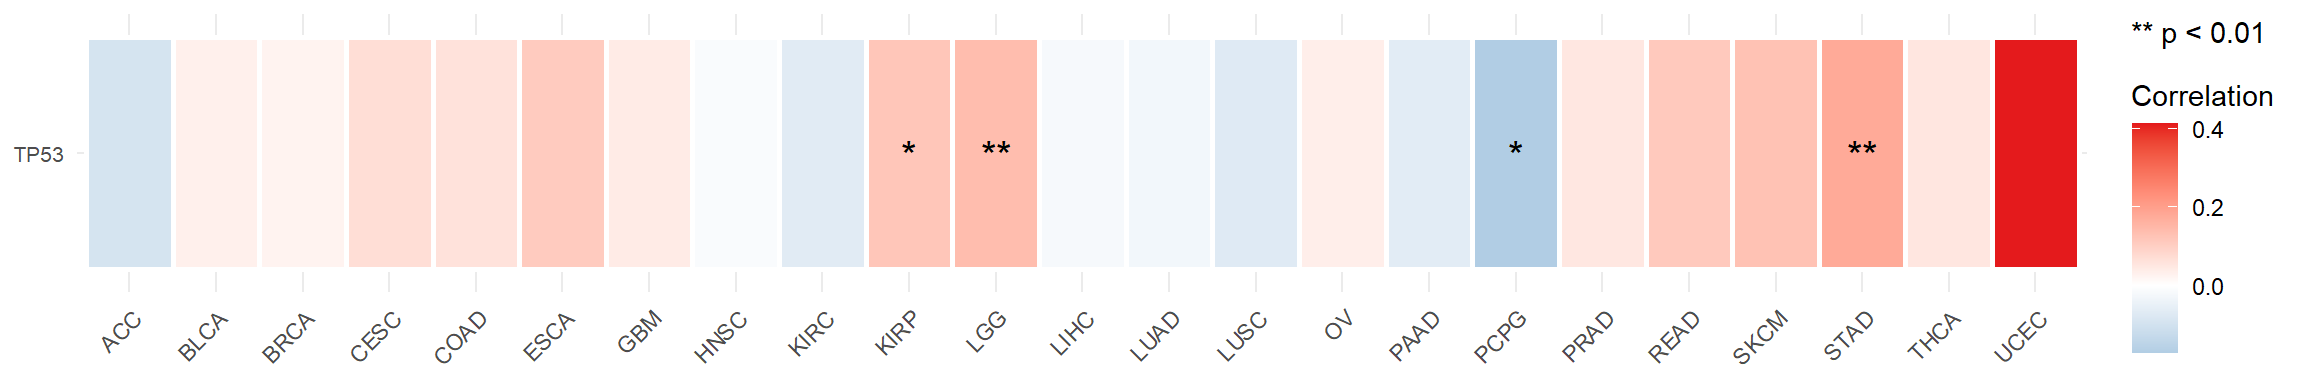
Figure 5.11: The correlation between mRNA TP53 and MSI score in tumor samples across pan-cancers
5.1.2.7 vis_gene_stemness_cor()
Calculate the correlation between one molecule and stemness score in tumor samples across pan-cancers. (Custom module)
- Basic use:
vis_gene_stemness_cor(Gene= , data_type= )
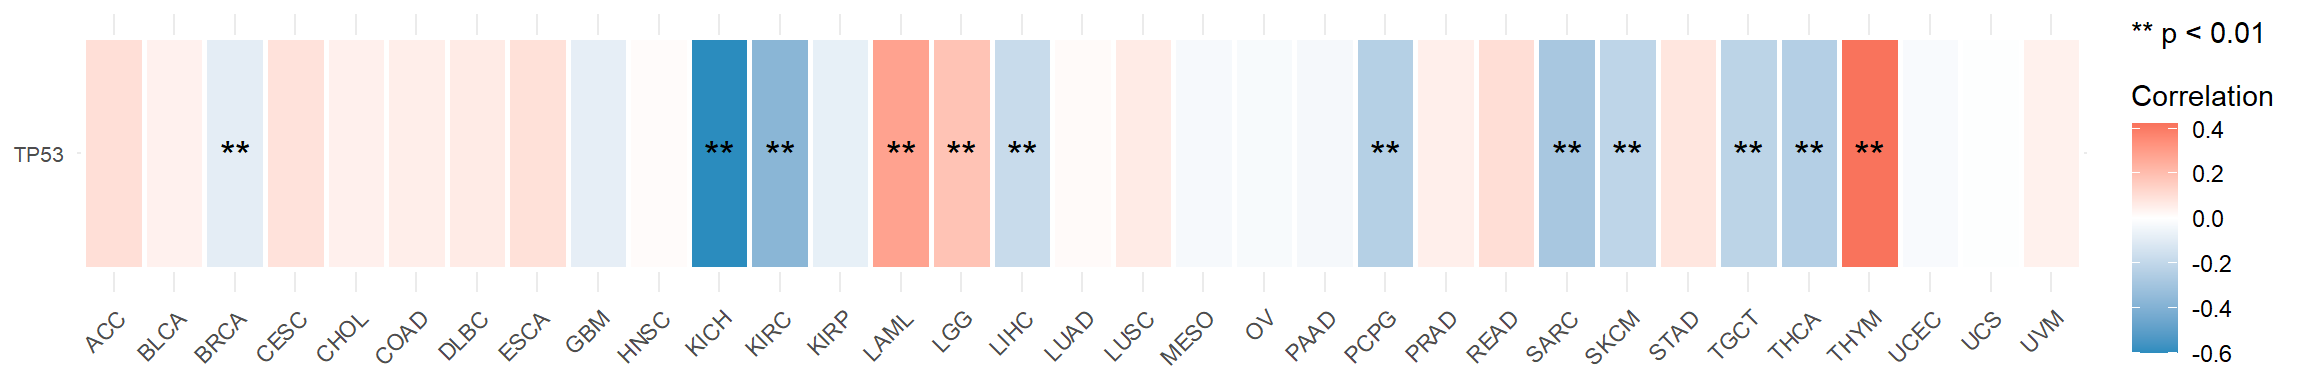
Figure 5.12: The correlation between mRNA TP53 and stemness score in tumor samples across pan-cancers
5.1.2.8 vis_gene_pw_cor()
Calculate the correlation between one molecule and pathway score in tumor samples of one cancer. (Custom module)
- Basic use:
vis_gene_pw_cor(Gene= , data_type= )
vis_gene_pw_cor(Gene = "TP53", data_type = "mRNA",
                pw_name = "HALLMARK_ADIPOGENESIS",
                cancer_choose = "ACC")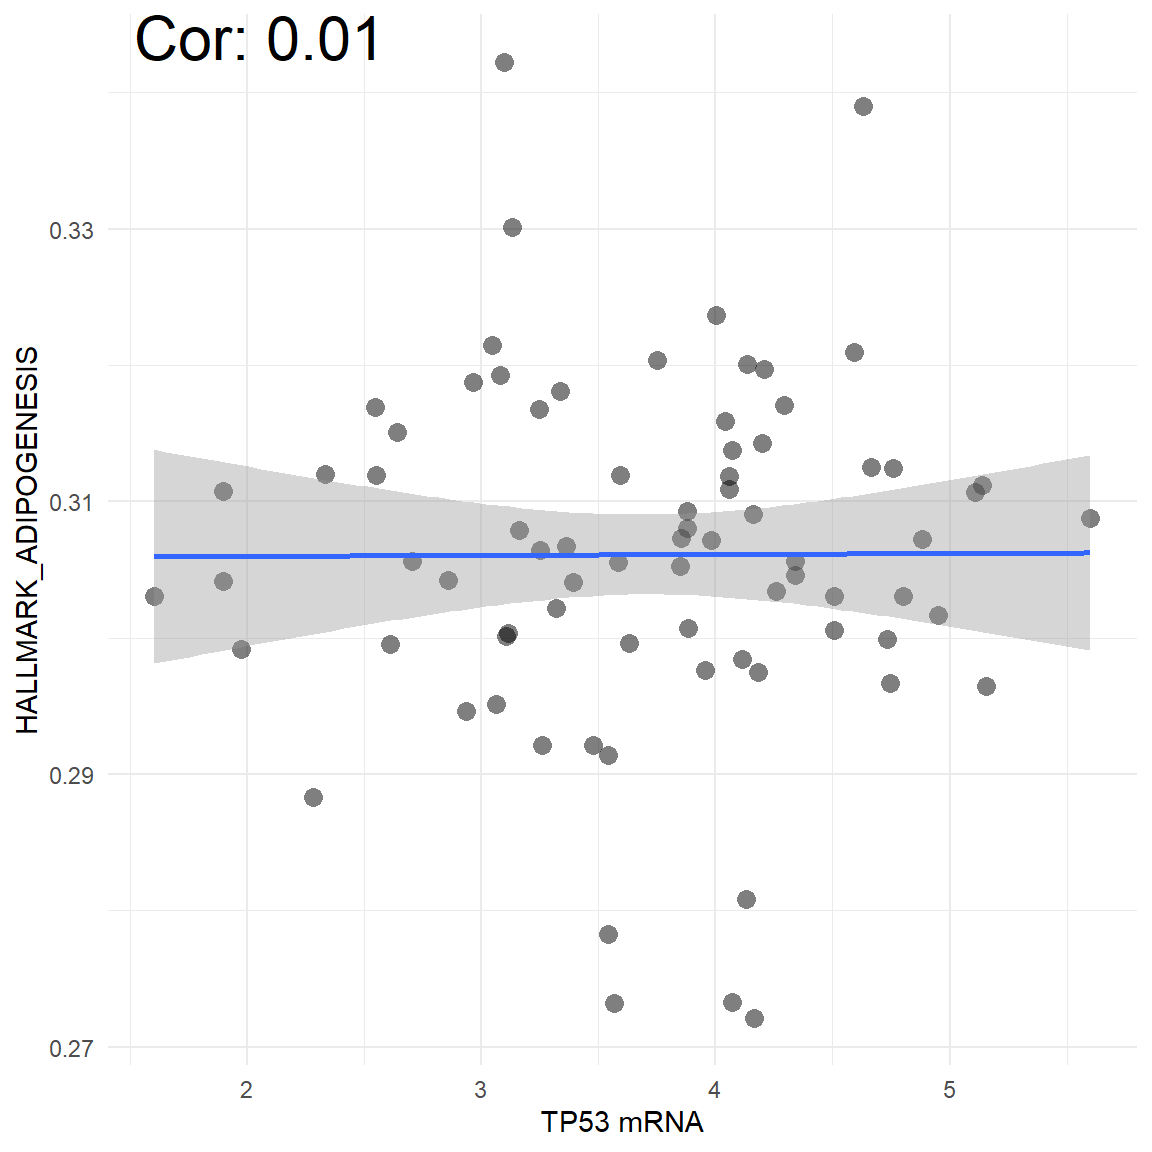
Figure 5.13: The correlation between mRNA TP53 and pathway score in tumor samples in ACC cancer
5.1.3 Survival analysis
5.1.3.1 tcga_surv_plot()
Perform the log-rank test of one molecule for one cancer. (Custom module)
- Basic use:
tcga_surv_plot(data=, time= , status= )
# Firstly, prepare the molecular value as well as survival data
data <- tcga_surv_get(item = "TP53",profile = "mRNA",
                      TCGA_cohort = "LUAD")
head(data)
## # A tibble: 6 × 13
## sampleID value OS OS.time DSS DSS.time DFI DFI.time PFI PFI.time
## <chr> <dbl> <dbl> <dbl> <dbl> <dbl> <dbl> <dbl> <dbl> <dbl>
## 1 TCGA-05-4420… 4.51 0 912 0 912 0 912 0 912
## 2 TCGA-91-6840… 5.90 0 372 0 372 0 372 0 372
## 3 TCGA-44-6778… 5.30 0 1864 0 1864 0 1864 0 1864
## 4 TCGA-67-3774… 5.22 0 385 0 385 NA NA 0 385
## 5 TCGA-64-1679… 5.46 0 2488 0 2488 0 2488 0 2488
## 6 TCGA-55-6982… 4.54 1 995 1 995 NA NA 1 183
## # ℹ 3 more variables: gender <chr>, age <dbl>, stage <chr>## Warning in do_once((if (is_R_CMD_check()) stop else warning)("The function
## xfun::isFALSE() will be deprecated in the future. Please ", : The function
## xfun::isFALSE() will be deprecated in the future. Please consider using
## base::isFALSE(x) or identical(x, FALSE) instead.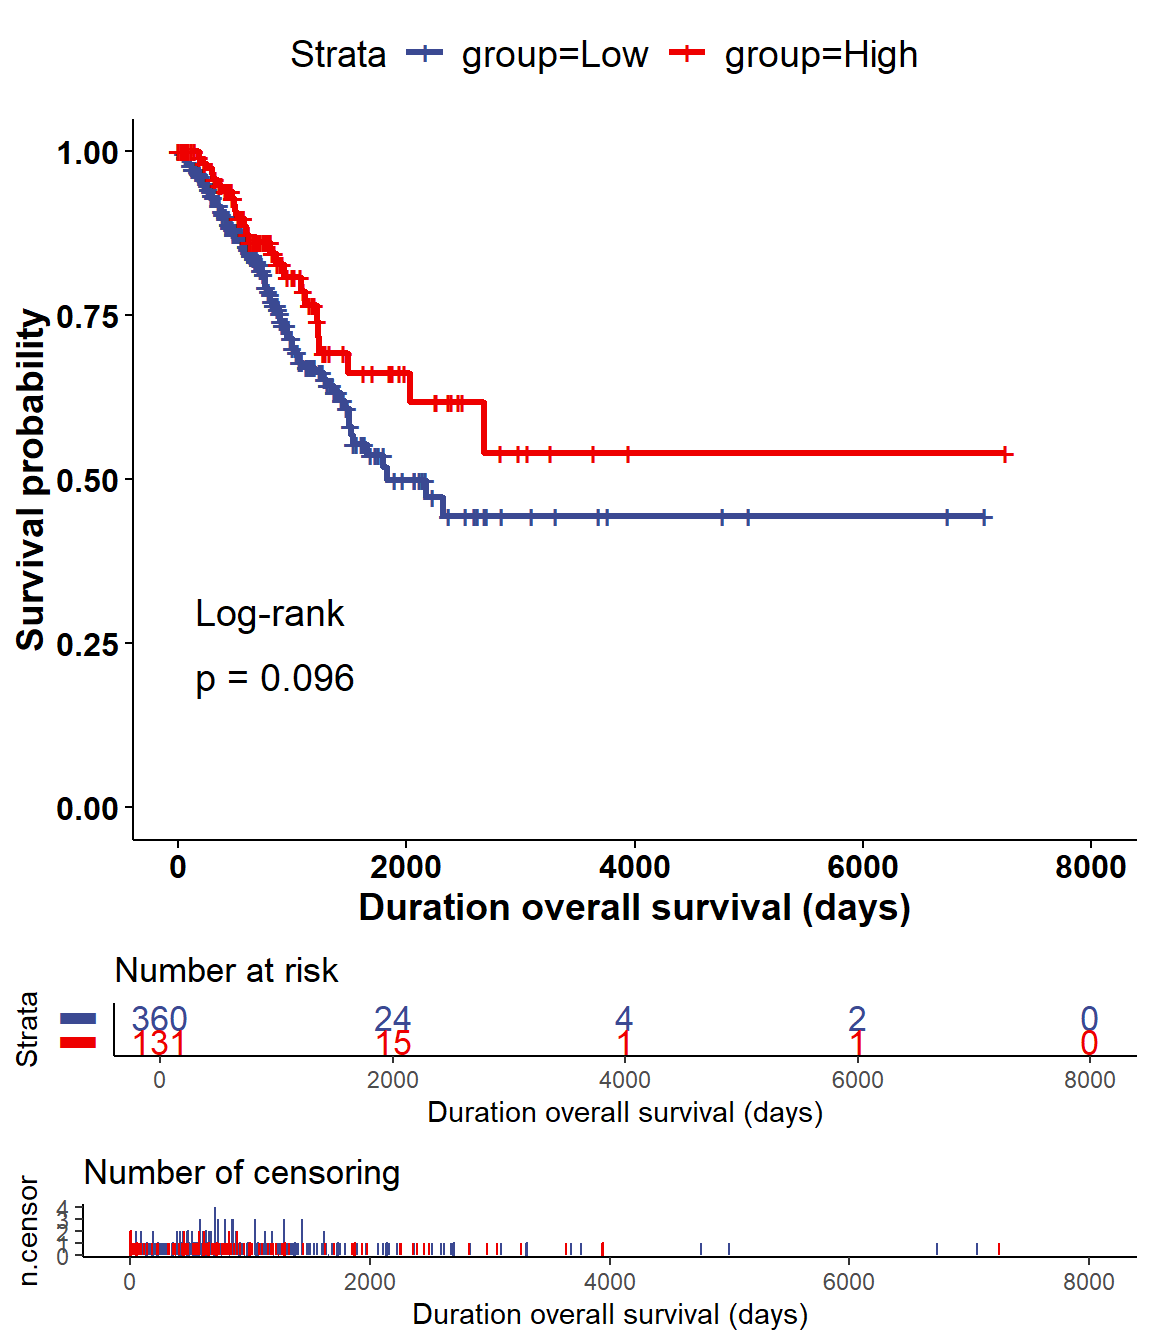
Figure 5.14: The log-rank test (DSS) of mRNA TP53 for LUAD cancer
By default, the median data of molecular data is used to divided into two groups for log-rank test. It can be modified in corresponding paramters.
5.1.3.2 vis_unicox_tree()
Perform the Cox regression analysis of one molecule across pan-cancers. (Custom module)
- Basic use:
vis_unicox_tree(Gene= , data_type= , measure=)
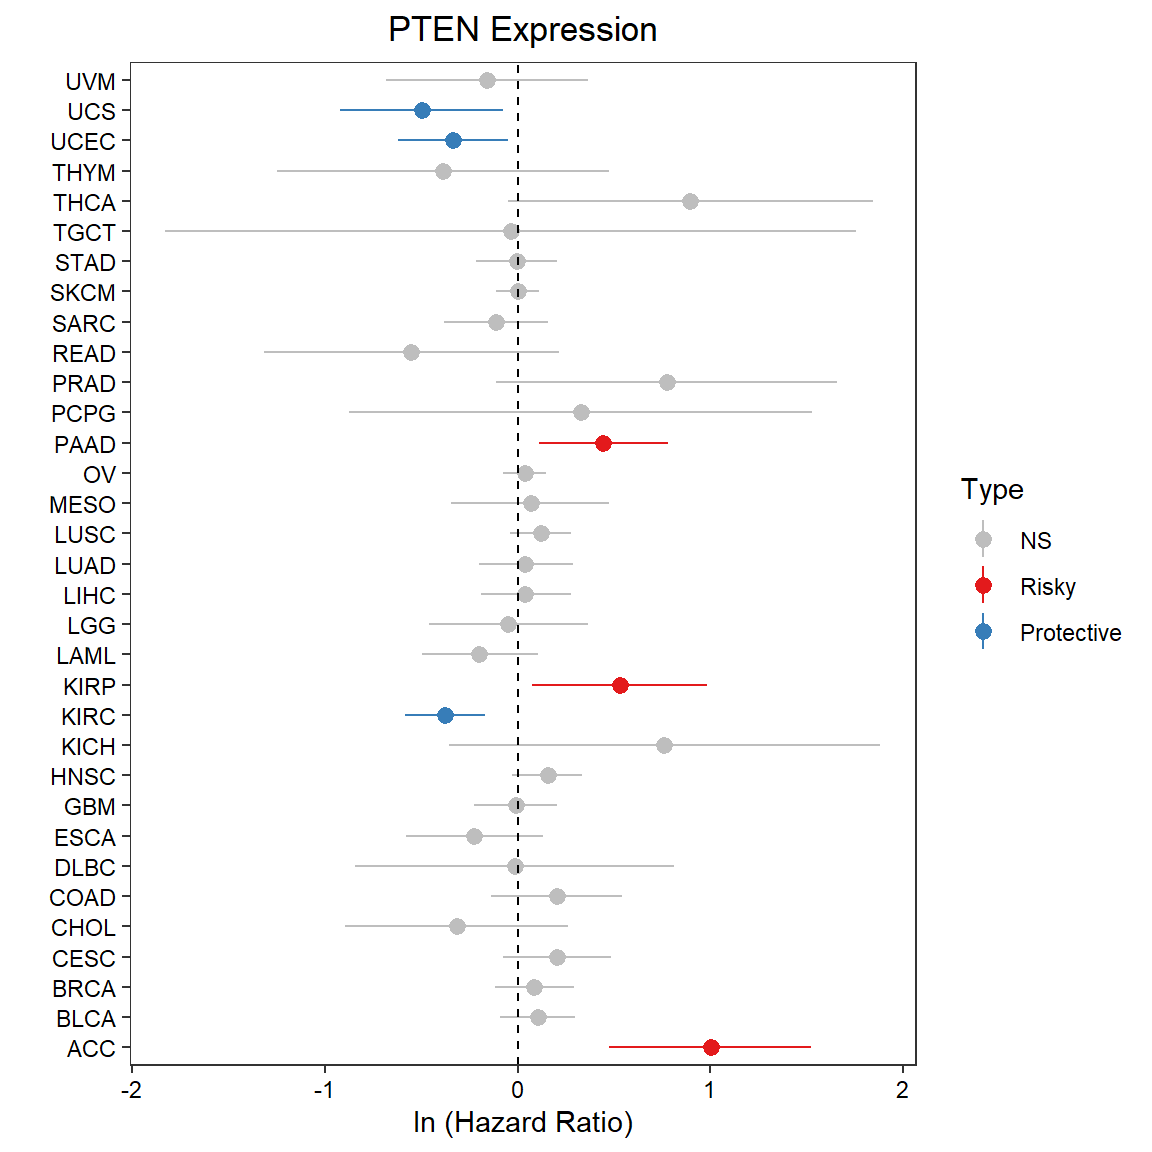
Figure 5.15: The Cox regression analysis (OS) of mRNA PTEN across pan-cancers
By default, the median data of molecular data is used to divided into two groups for Cox regression analysis. It can be modified in corresponding paramters.
5.1.4 Dimension reduction
5.1.4.1 vis_dim_dist()
Perform dimension reduction analysis of multiple molecules for samples in groups. (Custom module)
- Basic use:
vis_dim_dist(ids=, data_type= ,group_info= )
# Firstly, prepare the grouping information of samples
group_info = tcga_clinical_fine %>%
  dplyr::filter(Cancer=="BRCA") %>%
  dplyr::select(Sample, Code) %>%
  dplyr::rename(Group=Code)
head(group_info)
## # A tibble: 6 × 2
## Sample Group
## <chr> <chr>
## 1 TCGA-3C-AAAU-01 TP
## 2 TCGA-3C-AALI-01 TP
## 3 TCGA-3C-AALJ-01 TP
## 4 TCGA-3C-AALK-01 TP
## 5 TCGA-4H-AAAK-01 TP
## 6 TCGA-5L-AAT0-01 TPids = c("TP53", "KRAS", "PTEN", "MDM2", "CDKN1A")
vis_dim_dist(ids = ids, data_type = "mRNA",
group_info= group_info)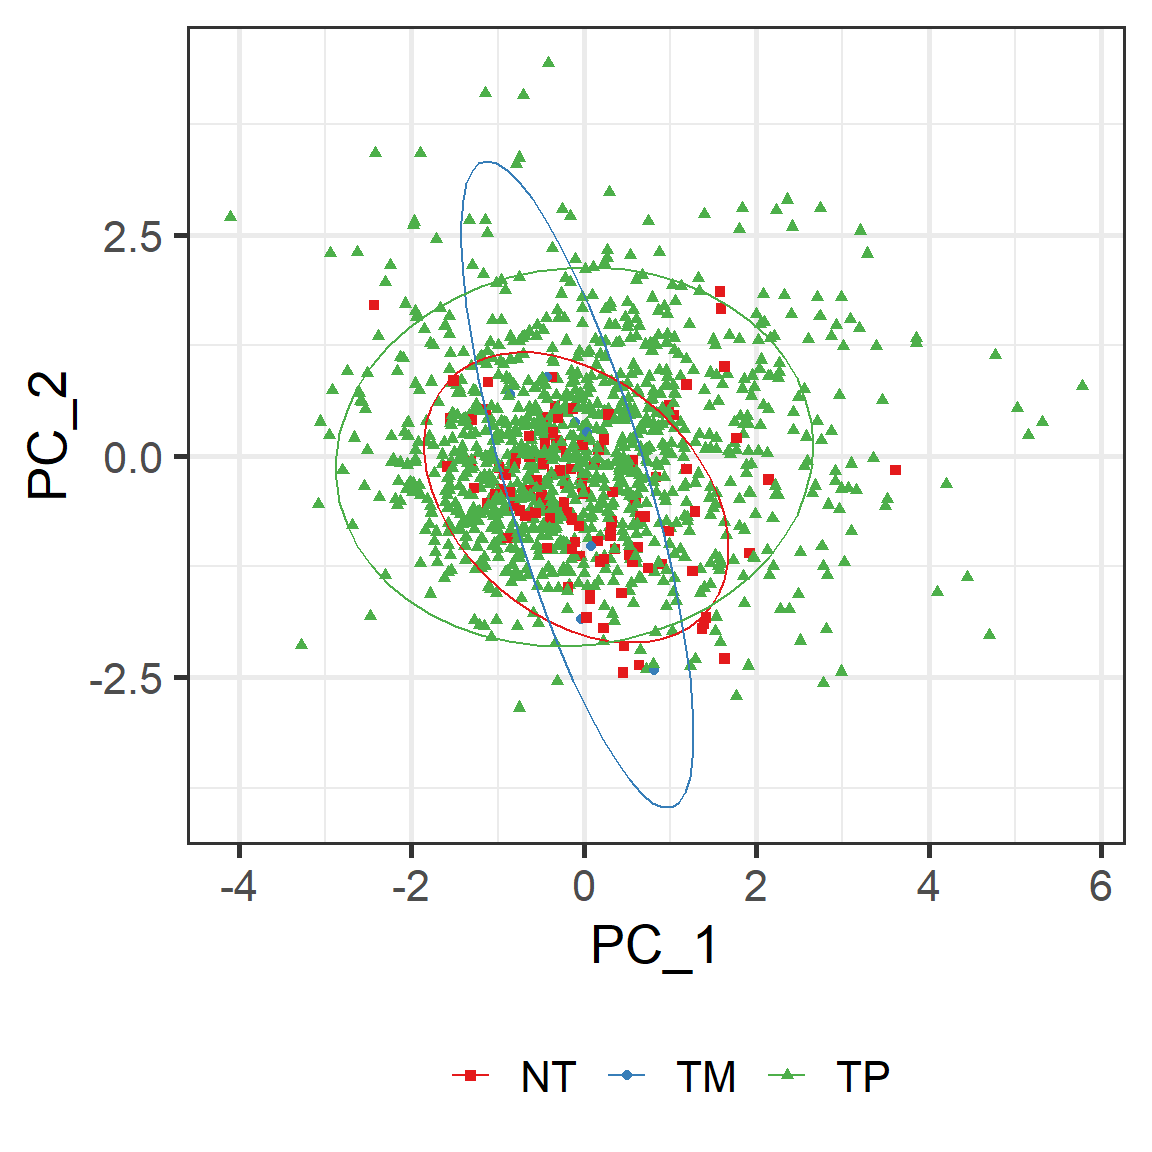
Figure 5.16: The dimension reduction analysis (PCA) of 5 mRNA molcules in BRCA cancer samples grouped by tissue codes
5.2 PCAWG analysis
| Database | Type | Function |
|---|---|---|
| PCAWG | Comparison | vis_pcawg_dist() |
| PCAWG | Correlation | vis_pcawg_gene_cor() |
| PCAWG | Survival | vis_pcawg_unicox_tree() |
5.2.1 Comparsion analysis
5.2.1.1 vis_pcawg_dist()
Compare molecular value between tumor and normal samples across pan-cancer. (Custom module)
- Basic use:
vis_pcawg_dist(Gene= ,data_type= )

5.2.2 Correlation analysis
5.2.2.1 vis_pcawg_gene_cor()
Calculate the correlation between two molecules value in tumor samples of one cancer. (Custom module)
- Basic use:
vis_pcawg_gene_cor(Gene1= ,data_type1 = ,Gene2 = ,data_type2 = ,dcc_project_code_choose=)
vis_pcawg_gene_cor(Gene1 = "CSF1R", data_type1 = "mRNA",
                   Gene2 = "JAK3", data_type2 = "mRNA",
                   dcc_project_code_choose = "BLCA-US")
5.2.3 Survival analysis
5.2.3.1 vis_pcawg_unicox_tree()
Perform the Cox regression analysis (OS) of one molecule across pan-cancers. (Custom module)
- Basic use:
vis_pcawg_unicox_tree(Gene= , data_type= )
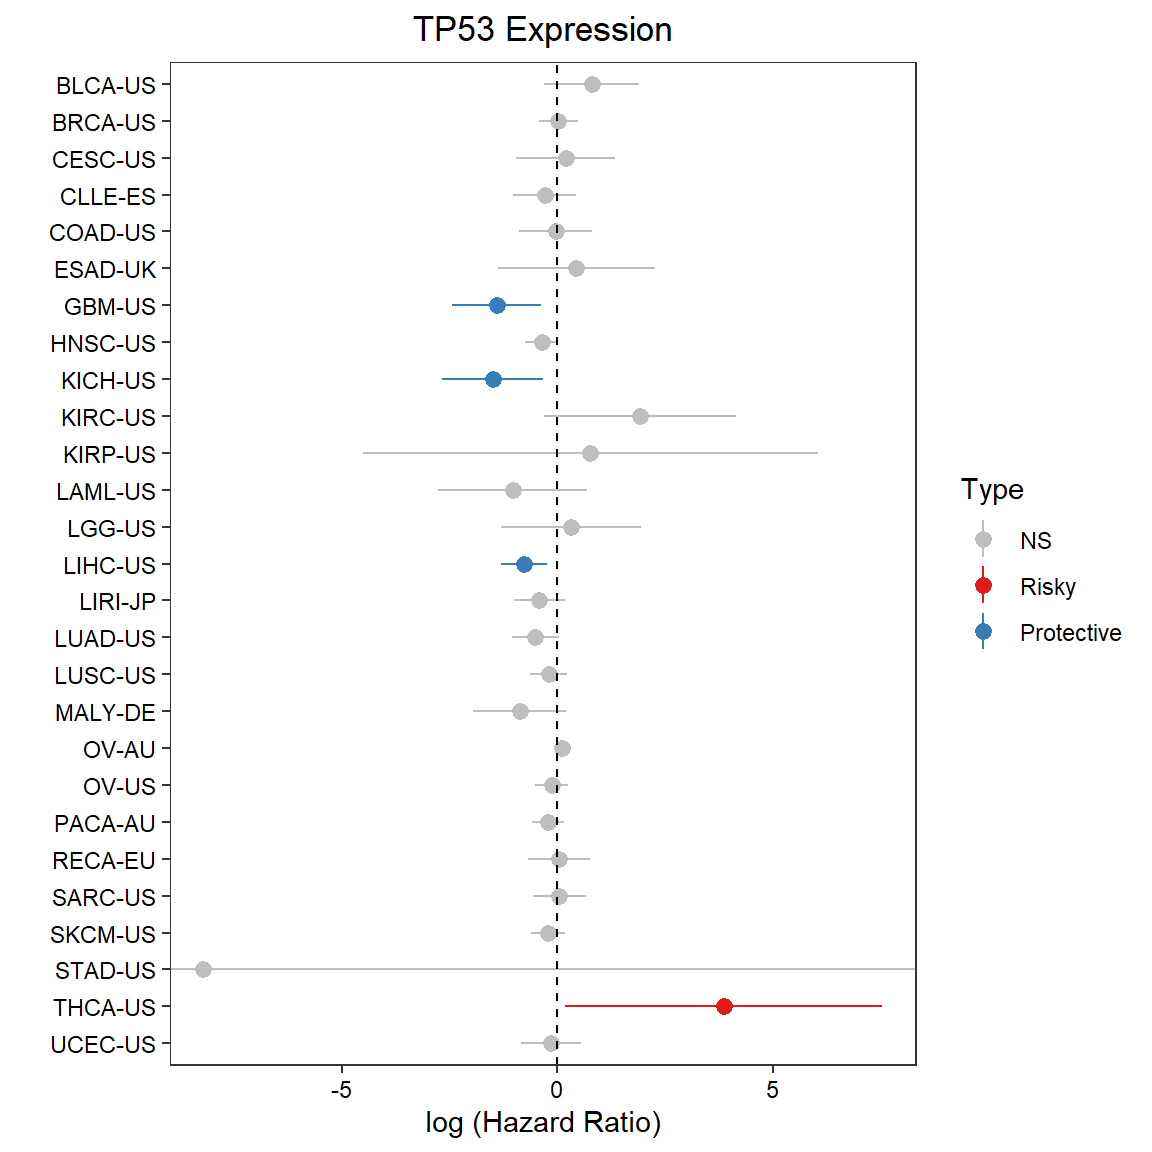
Figure 5.17: The Cox regression analysis (OS) of mRNA TP53 across pan-cancers
By default, the median data of molecular data is used to divided into two groups for Cox regression analysis. It can be modified in corresponding paramters.
5.3 CCLE analysis
| Database | Type | Function |
|---|---|---|
| CCLE | Comparison | vis_ccle_tpm() |
| CCLE | Comparison | vis_gene_drug_response_diff() |
| CCLE | Correlation | vis_ccle_gene_cor() |
| CCLE | Correlation | vis_gene_drug_response_asso() |
5.3.1 Comparsion analysis
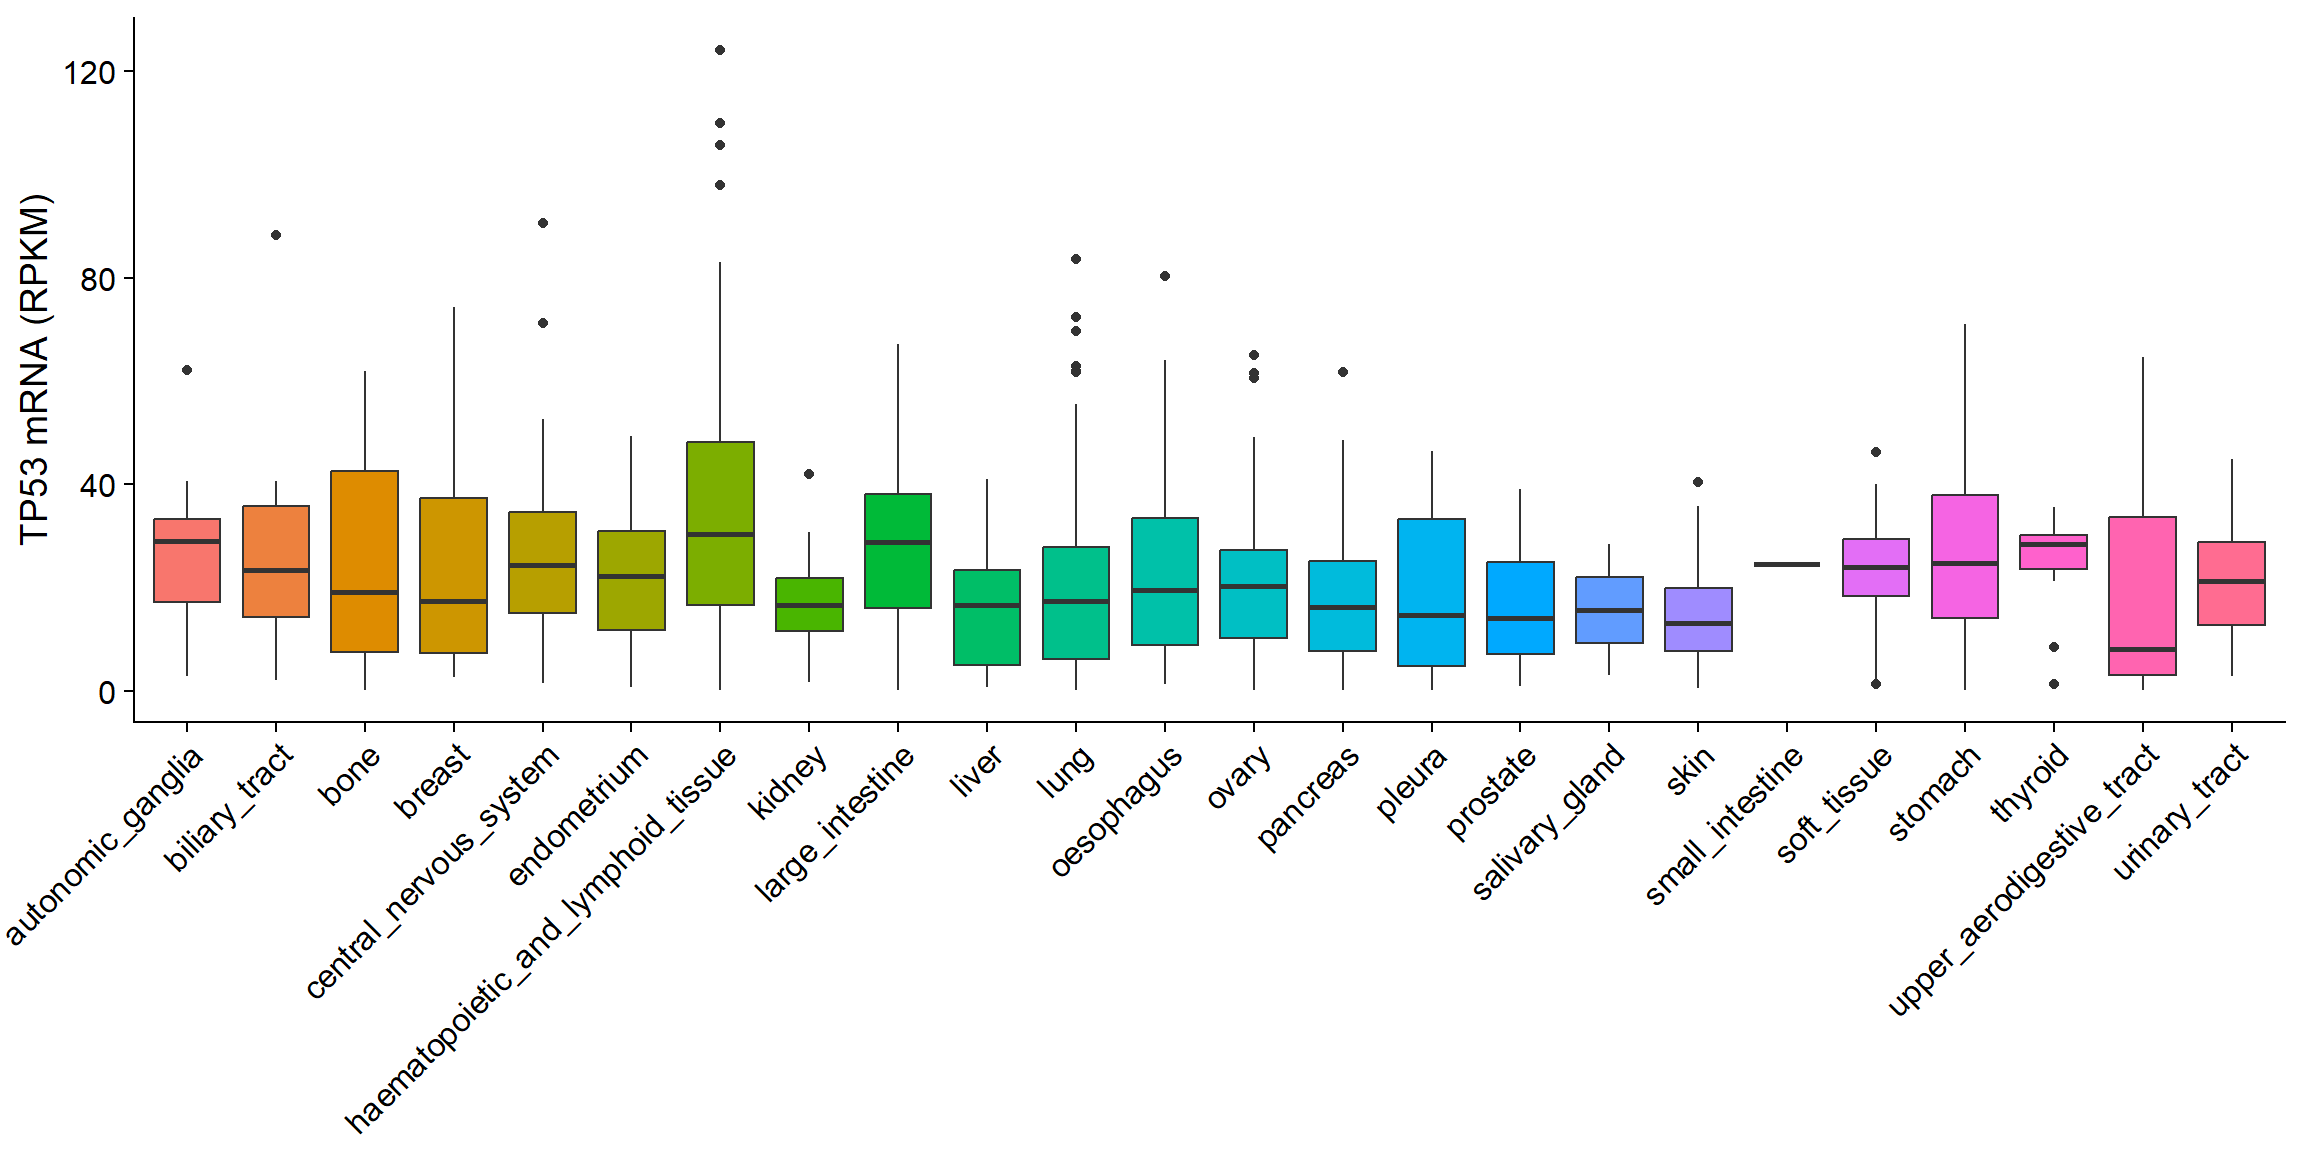
5.3.1.1 vis_ccle_tpm()
Compare molecular value among different tissues of cancer cell lines. (Custom module)
- Basic use:
vis_ccle_tpm(Gene= ,data_type= )
5.3.2 Correlation analysis
5.3.2.1 vis_ccle_gene_cor()
Calculate the correlation between two molecules value in one tissue type of cancer cell lines. (Custom module)
- Basic use:
vis_ccle_gene_cor(Gene1= ,data_type1= ,Gene2= ,data_type2= ,SitePrimary= )
vis_ccle_gene_cor(Gene1 = "CSF1R", data_type1 = "mRNA",
                  Gene2 = "JAK3", data_type2 = "mRNA",
                  SitePrimary = "prostate")
vis_gene_drug_response_diff()andvis_gene_drug_response_asso()are initially designed for drug pharmacogenomics analysis. In the updated shiny application, we have provided more comprehensive pharmacogenomics analysis.
5.4 General analysis
| Database | Type | Function |
|---|---|---|
| General | Comparison | vis_identifier_grp_comparison() |
| General | Correlation | vis_identifier_cor() |
| General | Correlation | vis_identifier_multi_cor() |
| General | Survival | vis_identifier_grp_surv() |
| General | Dimension Reduction | vis_identifier_dim_dist() |
5.4.1 Comparison analysis
5.4.1.1 vis_identifier_grp_comparison()
Compare molecular value between custom groups based on one genomics matrix UCSC Xena dataset. (Custom module)
- Basic use:
vis_identifier_grp_comparison(dataset= , id= ,grp_df= )
# Firstly, prepare custom groups of samples
library(UCSCXenaTools)
cli_df <- XenaGenerate(
  subset = XenaDatasets == "TCGA.LUAD.sampleMap/LUAD_clinicalMatrix"
) %>%
  XenaQuery() %>%
  XenaDownload() %>%
  XenaPrepare()
grp_df = cli_df[, c("sampleID", "pathologic_M")] %>%
  dplyr::filter(pathologic_M %in% c("M0", "M1", "MX"))
head(grp_df) # col-1: sample; col-2: grouping info
## # A tibble: 6 × 2
## sampleID pathologic_M
## <chr> <chr>
## 1 TCGA-05-4244-01 M1
## 2 TCGA-05-4249-01 M0
## 3 TCGA-05-4250-01 M0
## 4 TCGA-05-4382-01 M0
## 5 TCGA-05-4384-01 M0
## 6 TCGA-05-4389-01 M0mol_dataset <- "TCGA.LUAD.sampleMap/HiSeqV2_percentile"
vis_identifier_grp_comparison(dataset = mol_dataset, id = "TP53",
grp_df = grp_df)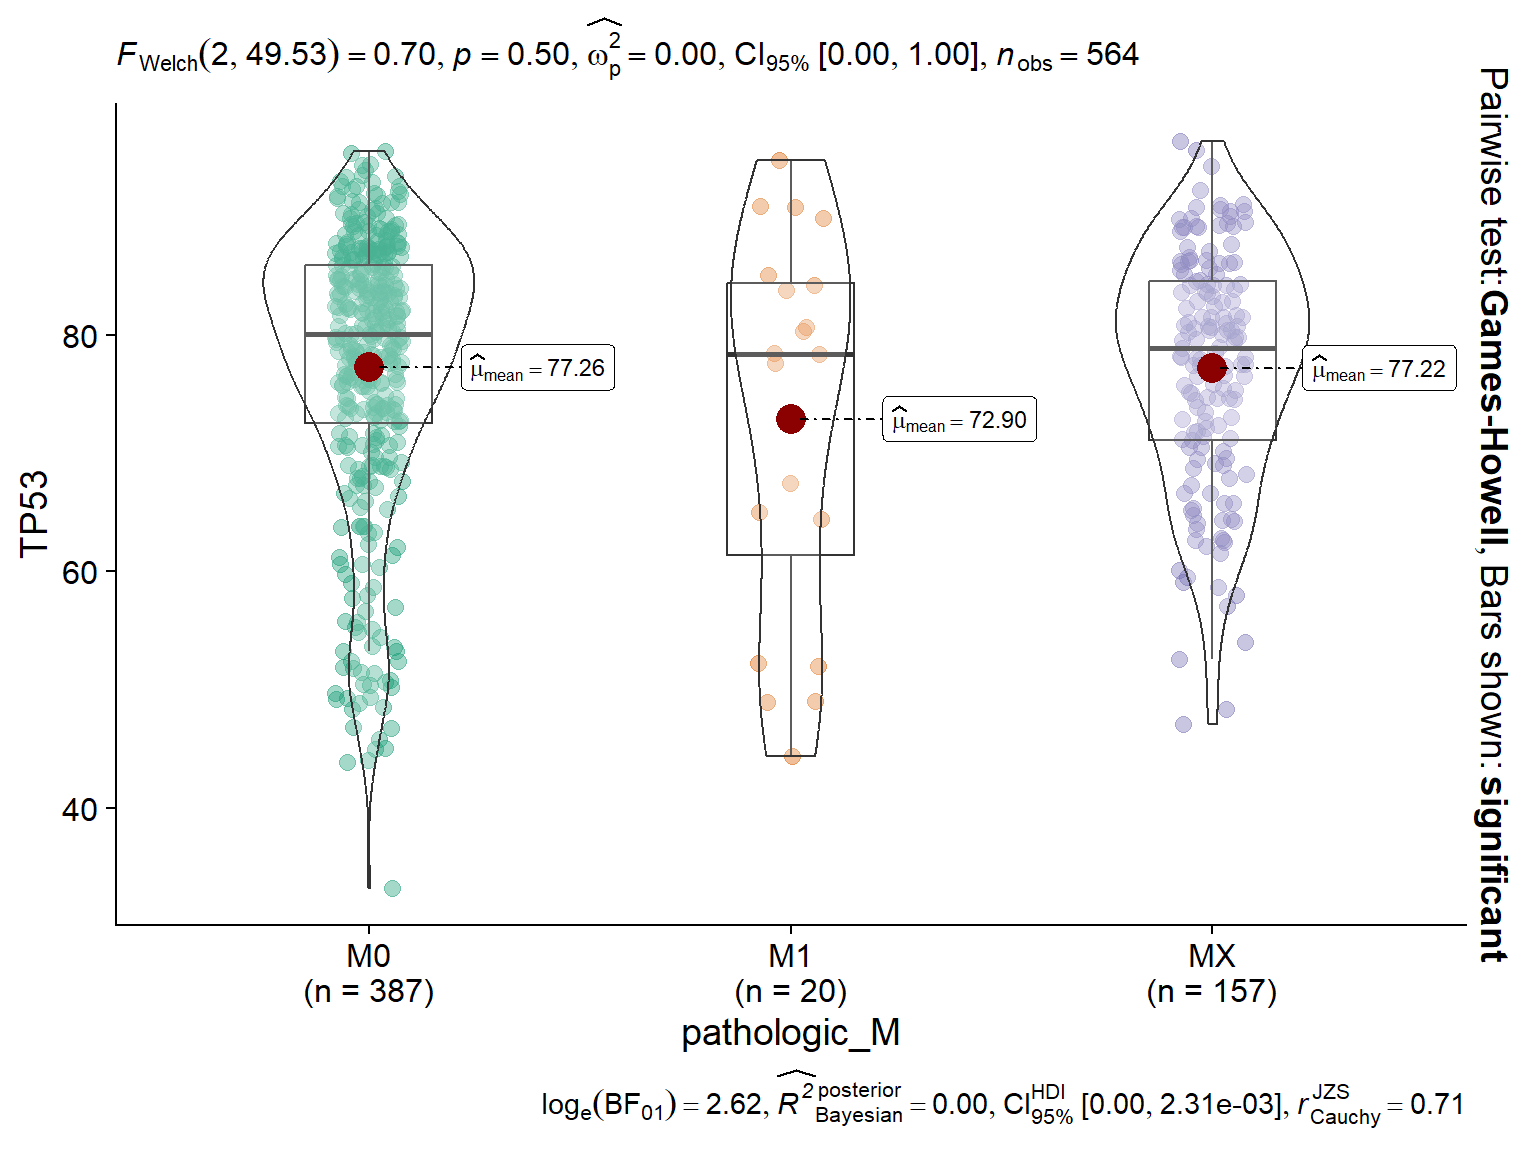
5.4.2 Correlation analysis
5.4.2.1 vis_identifier_cor()
Calculate the correlation between two molecules value from genomics matrix UCSC Xena datasets. (Custom module)
- Basic use:
vis_identifier_cor(dataset= ,id1= ,dataset= ,id2= )
dataset <- "TcgaTargetGtex_rsem_isoform_tpm"
vis_identifier_cor(dataset1 = dataset, id1 = "TP53",
                   dataset2 = dataset, id2 = "KRAS")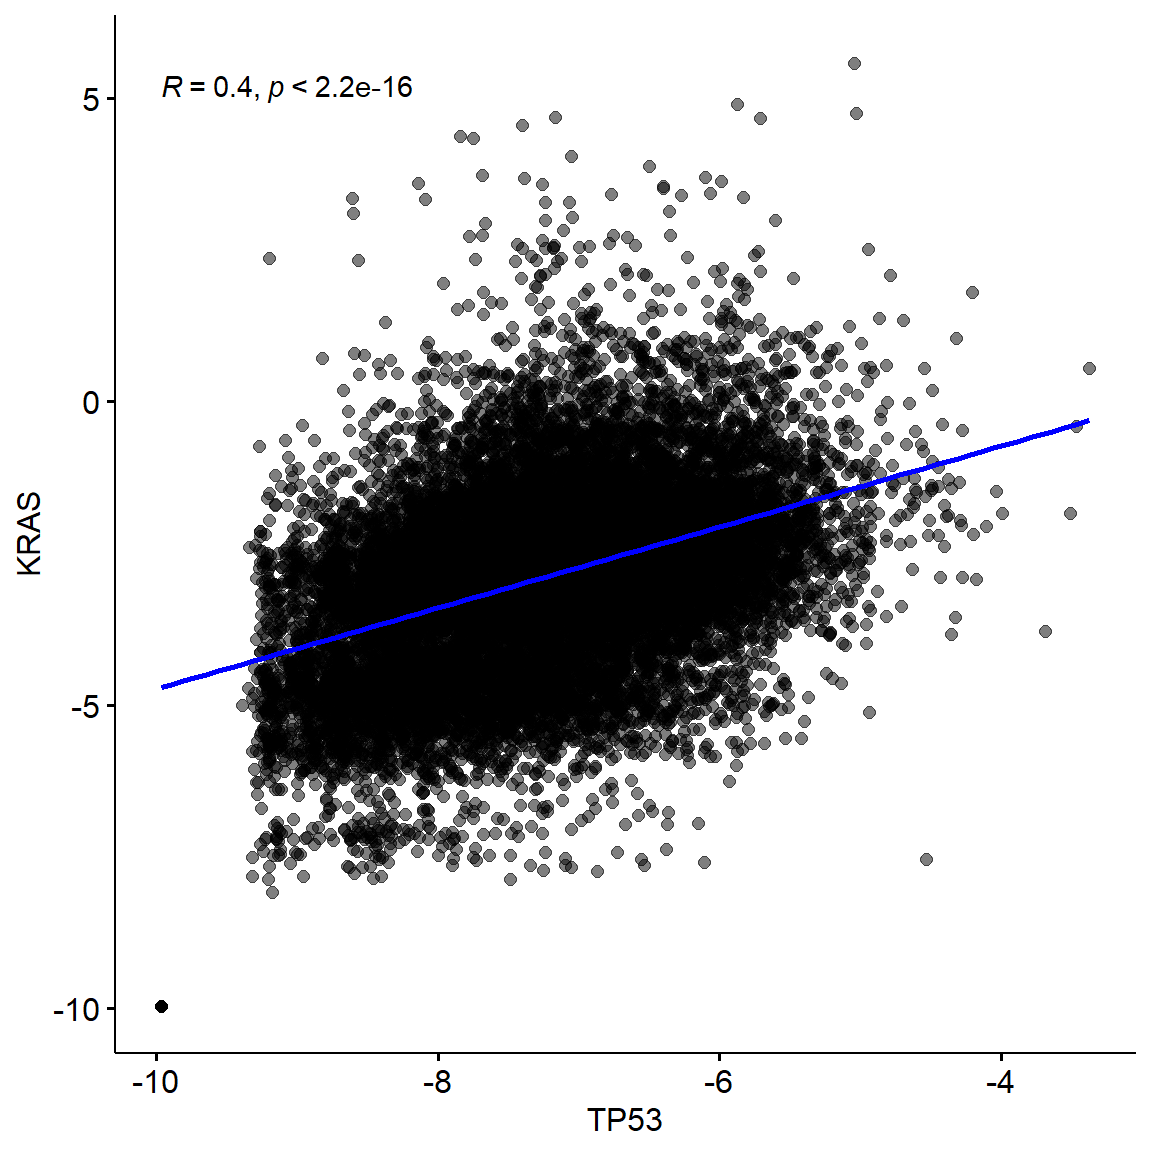
5.4.2.2 vis_identifier_multi_cor()
Calculate the pairwise correlation among multiple molecules value from one genomics matrix UCSC Xena dataset. (Custom module)
- Basic use:
vis_identifier_multi_cor(dataset= ,ids= )
dataset <- "TcgaTargetGtex_rsem_isoform_tpm"
vis_identifier_multi_cor(dataset = dataset,
                         ids = c("TP53", "KRAS", "PTEN"))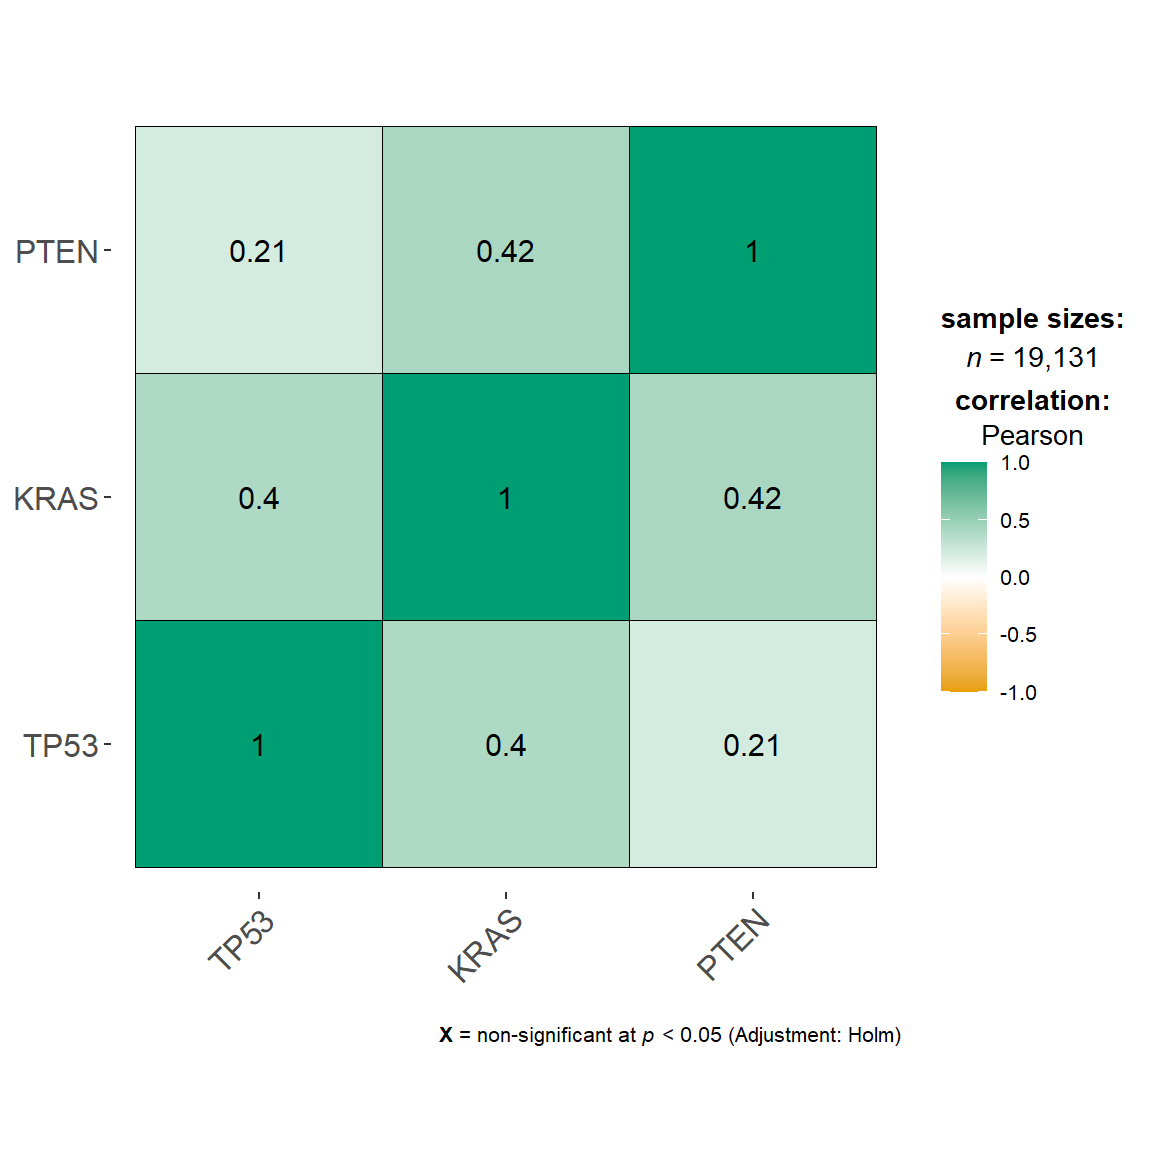
5.4.3 Survival analysis
5.4.3.1 vis_identifier_grp_surv()
Perform the log-rank test of one molecule for one genomics matrix UCSC Xena dataset. (Custom module)
- Basic use:
vis_identifier_grp_surv(dataset= , id= , surv_df= )
# Firstly, prepare survival data of samples
library(UCSCXenaTools)
cli_df <- XenaGenerate(
  subset = XenaDatasets == "TCGA.LUAD.sampleMap/LUAD_clinicalMatrix"
) %>%
  XenaQuery() %>%
  XenaDownload() %>%
  XenaPrepare()
surv_df <- cli_df[, c("sampleID", "days_to_death", "vital_status")]
surv_df$vital_status <- ifelse(surv_df$vital_status == "DECEASED", 1, 0)
surv_df = na.omit(surv_df)
head(surv_df)  # col-1: sample; col-2: survival time; col-3: survival status
## # A tibble: 6 × 3
## sampleID days_to_death vital_status
## <chr> <dbl> <dbl>
## 1 TCGA-05-4250-01 121 1
## 2 TCGA-05-4395-01 0 1
## 3 TCGA-05-4396-01 303 1
## 4 TCGA-05-4397-01 731 1
## 5 TCGA-05-4402-01 244 1
## 6 TCGA-05-4415-01 91 1mol_dataset <- "TCGA.LUAD.sampleMap/HiSeqV2_percentile"
vis_identifier_grp_surv(dataset = mol_dataset, id = "KRAS",
surv_df = surv_df)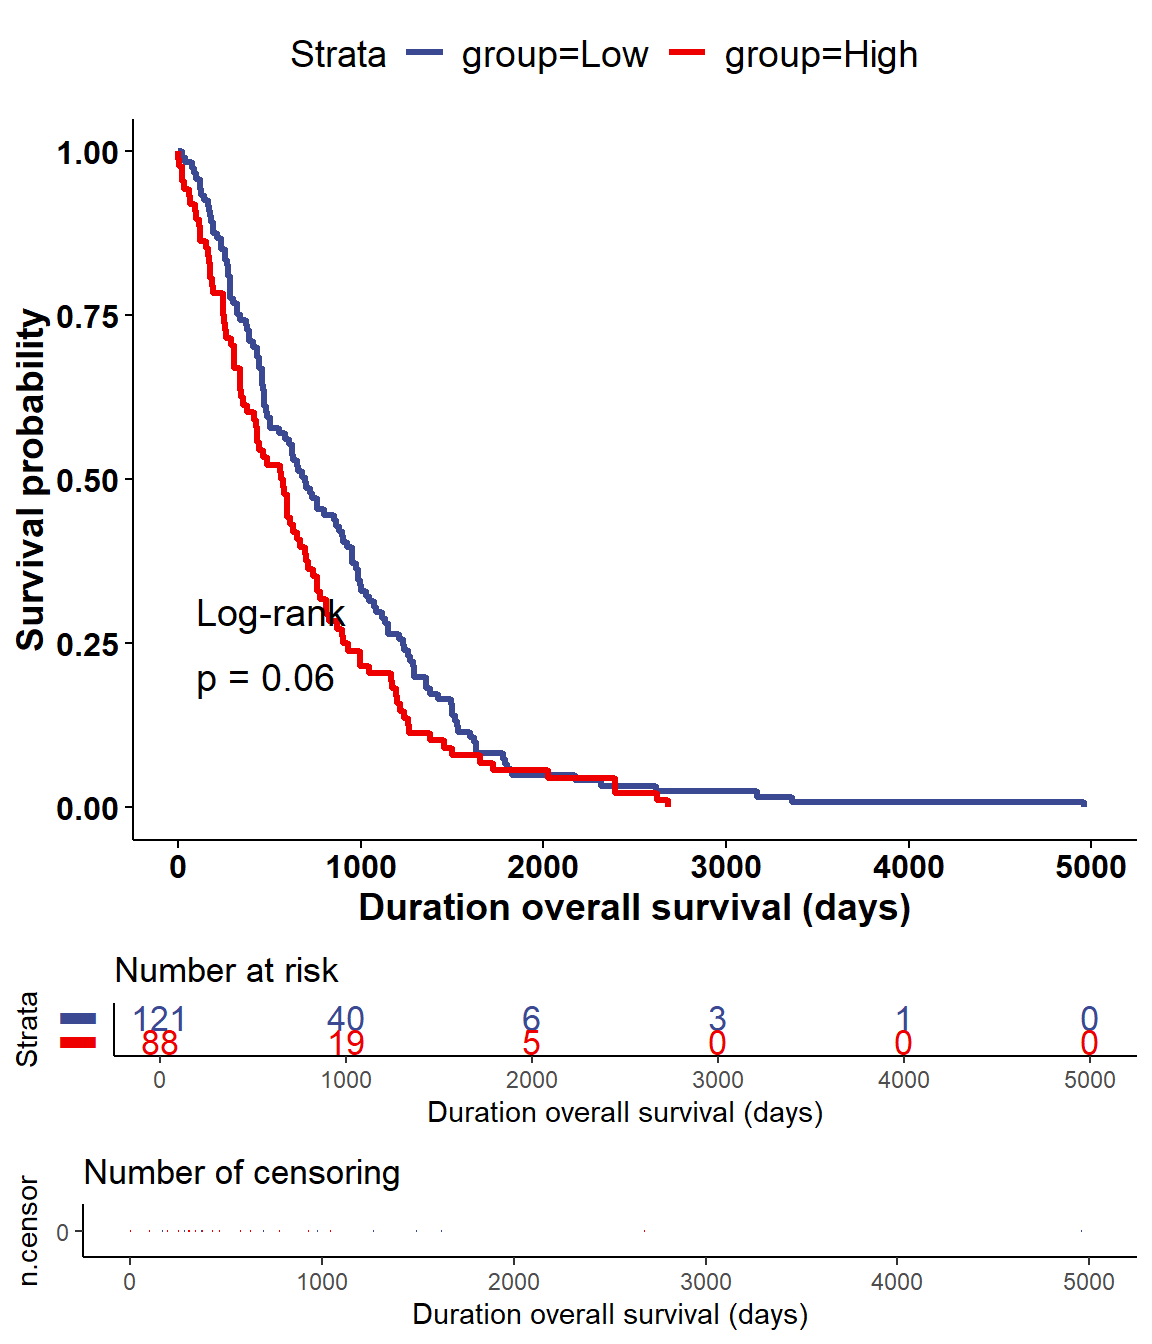
Figure 5.18: The log-rank test (DSS) of mRNA KRAS for ne specific dataset
By default, the best cutoff is decided. User can change it through the
cutoff_modeparameter.
5.4.4 Dimension reduction
5.4.4.1 vis_identifier_dim_dist()
Perform dimension reduction analysis of multiple molecules for samples in groups. (Custom module)
- Basic use:
vis_identifier_dim_dist(dataset= ,ids= , grp_df= )
# Firstly, prepare the grouping information of samples
library(UCSCXenaTools)
cli_dataset <- "TCGA.LUAD.sampleMap/LUAD_clinicalMatrix"
cli_df <- XenaGenerate(
  subset = XenaDatasets == cli_dataset
) %>%
  XenaQuery() %>%
  XenaDownload() %>%
  XenaPrepare()
grp_df = cli_df[, c("sampleID", "gender")]
head(grp_df) # col-1: sample; col-2: grouping info
## # A tibble: 6 × 2
## sampleID gender
## <chr> <chr>
## 1 TCGA-05-4244-01 MALE
## 2 TCGA-05-4249-01 MALE
## 3 TCGA-05-4250-01 FEMALE
## 4 TCGA-05-4382-01 MALE
## 5 TCGA-05-4384-01 MALE
## 6 TCGA-05-4389-01 MALEmol_dataset <- "TCGA.LUAD.sampleMap/HiSeqV2_percentile"
ids = c("TP53", "KRAS", "PTEN", "MDM2", "CDKN1A")
vis_identifier_dim_dist(dataset = mol_dataset,
ids = ids,
grp_df = grp_df)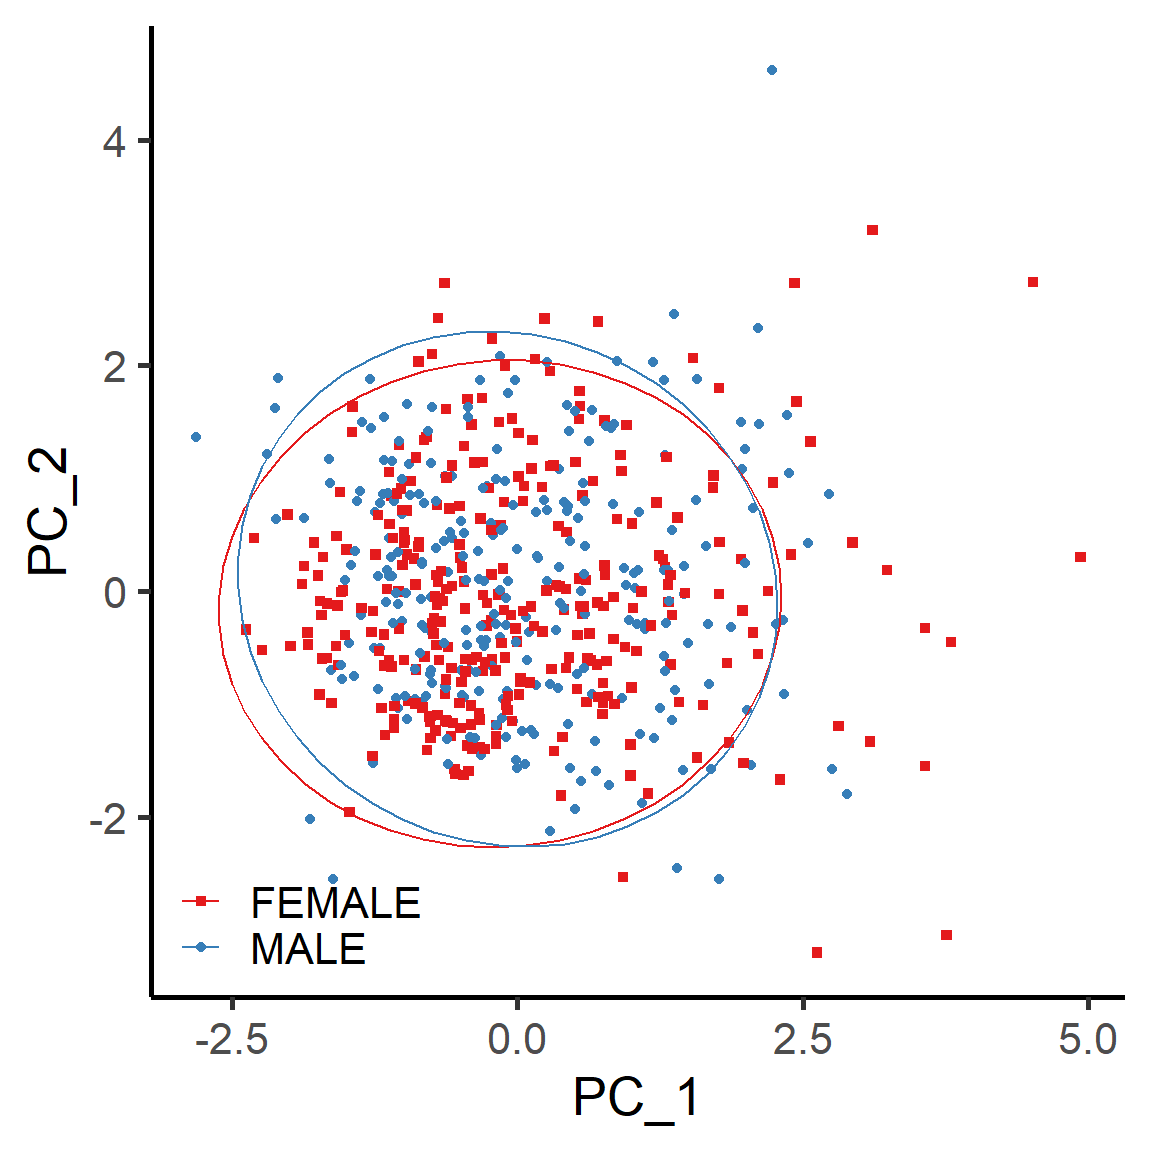
Figure 5.19: The dimension reduction analysis (PCA) of 5 mRNA molcules in BRCA cancer samples grouped by tissue codes