主要参考教程 :https://shiny.rstudio.com/tutorial/written-tutorial/lesson1/
1、基本框架#
(1)ui:布局呈现给用户的输入、输出界面
(2)server:处理用户的输入,返回输出结果的内部计算函数
(3)shinyApp命令整合上述的ui与server
 1
 2
 3
 4
 5
 6
 7
 8
 9
10
11
12
13
14
15
16
17
18
19
20
21
22
23
24
25
26
27
28
29
|
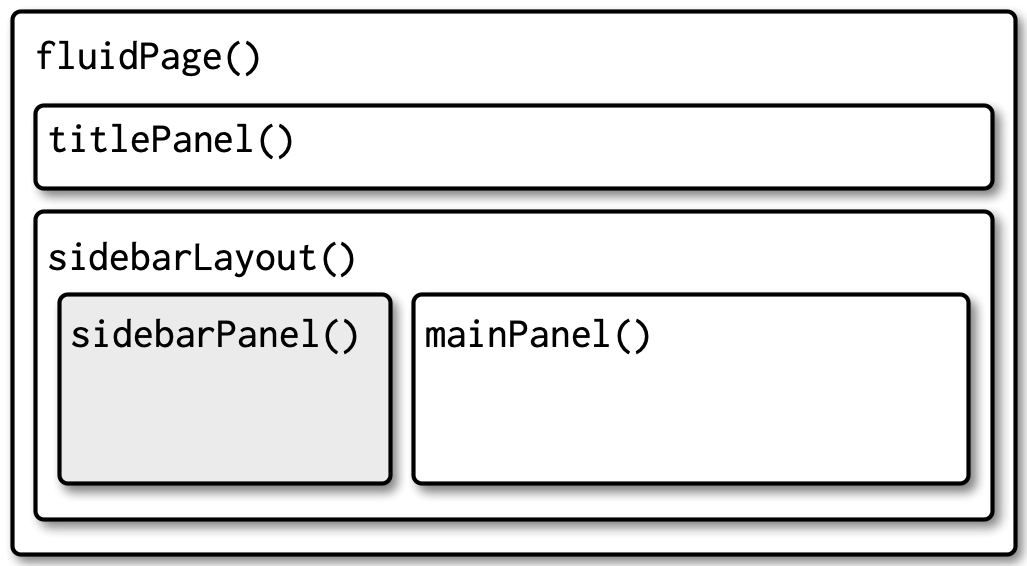
##(1) 模板--常见布局方式
library(shiny)
ui <- fluidPage(
  #标题栏
  titlePanel("This is total title"),

  #主体部分
  sidebarLayout(
    #侧边用户输入栏
    sidebarPanel(
      "side panel",
      ****Input()
    ),

    #展示计算输出栏
    mainPanel(
      "main panle",
      ****Output("var1")
    )
  )   #sidebarLayout()
)     #fluidPage()

server <- function(input, output) {
  output$var1 <- render****({
    *******input$**
  })
}

shinyApp(ui, server)
|
 1
 2
 3
 4
 5
 6
 7
 8
 9
10
11
12
13
14
15
16
17
18
19
20
21
22
23
24
25
26
27
28
29
30
31
32
|
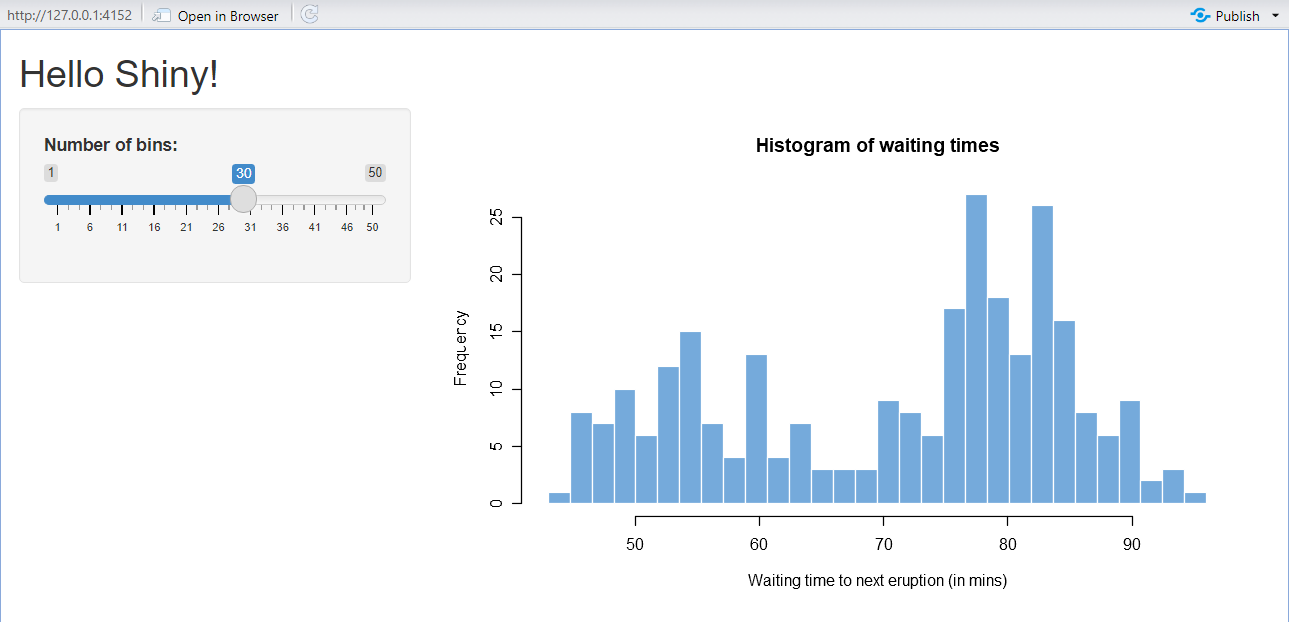
##(2)示例
library(shiny)
ui <- fluidPage(
  titlePanel("Hello Shiny!"),

  sidebarLayout(
    sidebarPanel(

      sliderInput(inputId = "bins",
                  label = "Number of bins:",
                  min = 1,
                  max = 50,
                  value = 30)
    ),

    mainPanel(
      plotOutput(outputId = "distPlot")
    )
  )
)

server <- function(input, output) {
  output$distPlot <- renderPlot({
    x    <- faithful$waiting
    bins <- seq(min(x), max(x), length.out = input$bins + 1)
    hist(x, breaks = bins, col = "#75AADB", border = "white",
         xlab = "Waiting time to next eruption (in mins)",
         main = "Histogram of waiting times")
    })
}

shinyApp(ui = ui, server = server)
|
如上设置是比较基础、常规的shiny界面布局;对于具体控件、输出的位置完全可以自由安排。
(1)在Rstudo的script面板中编辑、保存好上述三个部分好,在右上角会自动出现一个Run App的选项,可方便地调试。
(2)调试完成后,将script重命名为app.R,放置在一个文件夹内。然后在该文件夹所在工作目录使用runApp()函数运行App
1
2
3
4
5
6
7
|
library(shiny)
list.files("test01/")
# [1] "app.R"

runApp("test01")                                 #直接运行
runApp("test01", display.mode = "showcase")      #在界面同时显示app.R代码
runApp("test01", port = 3344)                    #指定端口,否则会随机选择
|
在之前,是将 ui与server分为两个单独的脚本,分别命名为ui.R,server.R。目前支持合并到了一个app.R里面,更方便些。
(1)shiny最重要的特点是交互性,可根据用户特定的输入,进行内部计算后,然后在输出栏呈现。
(2)这些输入可大体分为:字符串、数值、逻辑值等;shiny包相应地提供了一系列的***Input()函数,用于接受用户的输入。
(3)通常这些函数的
- 第一个参数
inputId为输入变量的ID名,在之后内部计算时,传递这些变量,用户不可见。
- 第二个参数
label设置这些widget的标签信息,用于提示用户输入。
- 之后的参数,因接受的不同类型输入,不同函数有不同的参数。可在每个函数的帮助文档获得详细的介绍。
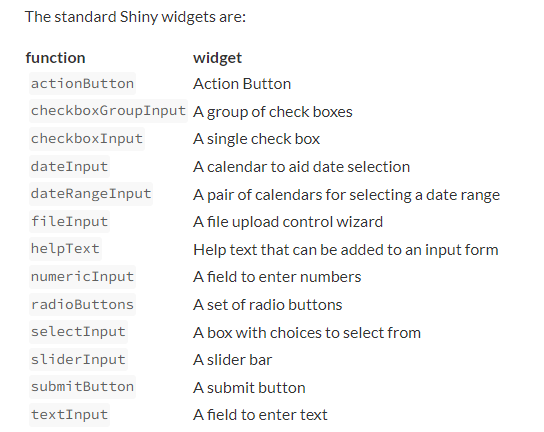
(4)觉得比较常用的有如下
 1
 2
 3
 4
 5
 6
 7
 8
 9
10
11
12
13
14
|
radioButtons("inputID", "Please choose one:",
             # choices设置选项名以及每个选项对应的值(传递给inputId)
             choices = c("Option A" = "norm",
                         "Option B" = "unif",
                         "Option C" = "lnorm",
                         "Option D" = "exp"),
             # selected设置初始值,默认为第一个选项的值
             selected = "unif",
             # inline设置是否横向排布选项
             inline = FALSE)

## checkboxGroupInput():多选框,可返回长度大于1的字符串变量
## selectInput():下拉列表,可调整参数设置单选或者多选
## textInput():用户接受用于自定义的字符串变量
|
1
2
3
4
5
6
7
|
sliderInput("inputID", "Please input a number:",
            #设置初始值,以及允许的最小、最大值从,移动步长
            value = 500, min = 0, max = 1000,
            #是否自动遍历所有的值,默认为FALSE
            animate = FALSE)

## numericInput():用户自定义传递数值
|
- 此外
checkboxInput()可用来传递逻辑值,fileInput()可用来上传csv等文件。
3、server计算与ui输出栏#
(1)如下,server本质是一个自定义函数,有两个list-like的参数
- input:可以理解为list对象,名字和值为上述widget传递的变量名与值
- output:同样可以理解为list对象,如下所示每一个part都是为了计算一个output(根据input的值变而变)
 1
 2
 3
 4
 5
 6
 7
 8
 9
10
|
server <- function(input, output) {
	output$outputID1 = render***({
        ...input$inputID...
        ...................  #默认返回最后一行的结果
    }),
    output$outputID2 = render***({
        ...input$inputID...
        ...................  #默认返回最后一行的结果
    })
}
|
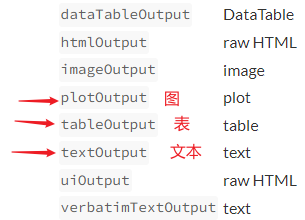
需要注意在计算每一个output时,都必须嵌套在render***函数类,用以传递不同类型的输出结果。
其中,目前觉得renderTable、renderPlot、renderText比较常用
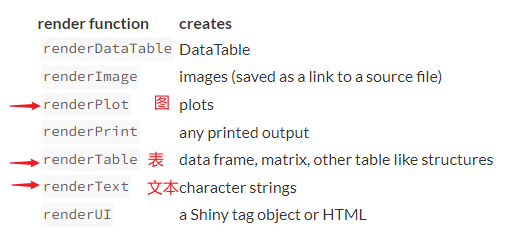
(2)对于上述server的计算结果,可在fluidPage()通过***Output系列函数传递给用户,基本与上面的render***函数存在对应关系。在使用时一般直接指定输出变量名作为参数即可。
1
2
|
##常置于fluidPage() → mainPanel()内
***Output("outputID")
|
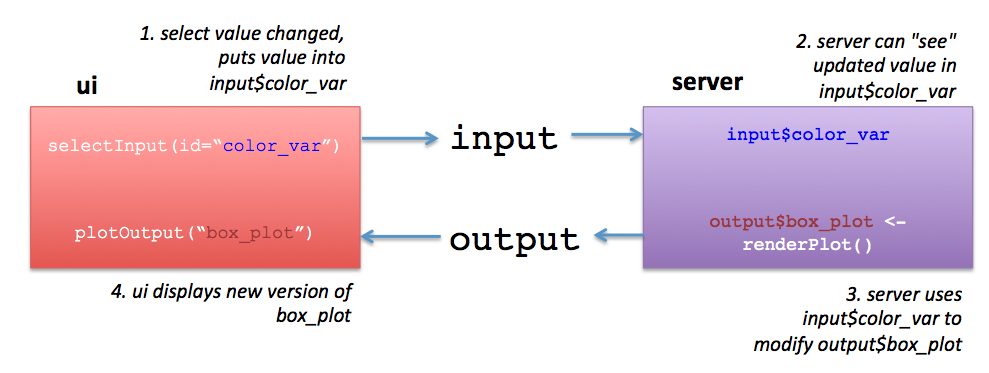
综上 ui与server,以及input与output的关系可以表示如下
4、文本格式化#
在UI界面中除了提示用户输入栏以及输出栏,还有可以添加一些文本、图片用以解释说明。
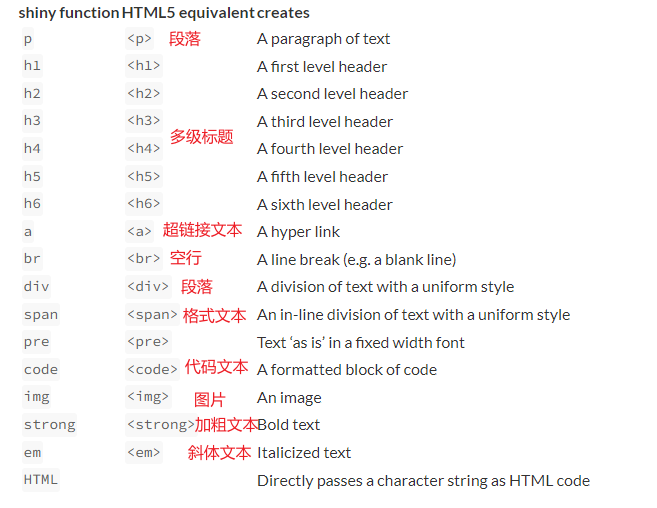
shiny包提供了一些可供设置文本格式的系列函数,以达到美观的效果。
-
p()与div()均表示段落,前者文本格式可不同,后者格式需一致
-
img()插入图片时,需在app.R脚本同级路径创建一个www文件夹,然后将图片文件置于内。之后就可以直接应用图片名。
-
在shiny的titlePanel()只能设置一个标题参数;对于其余主体部分,可自由布局文本、图片,以及input、output的位置。
-
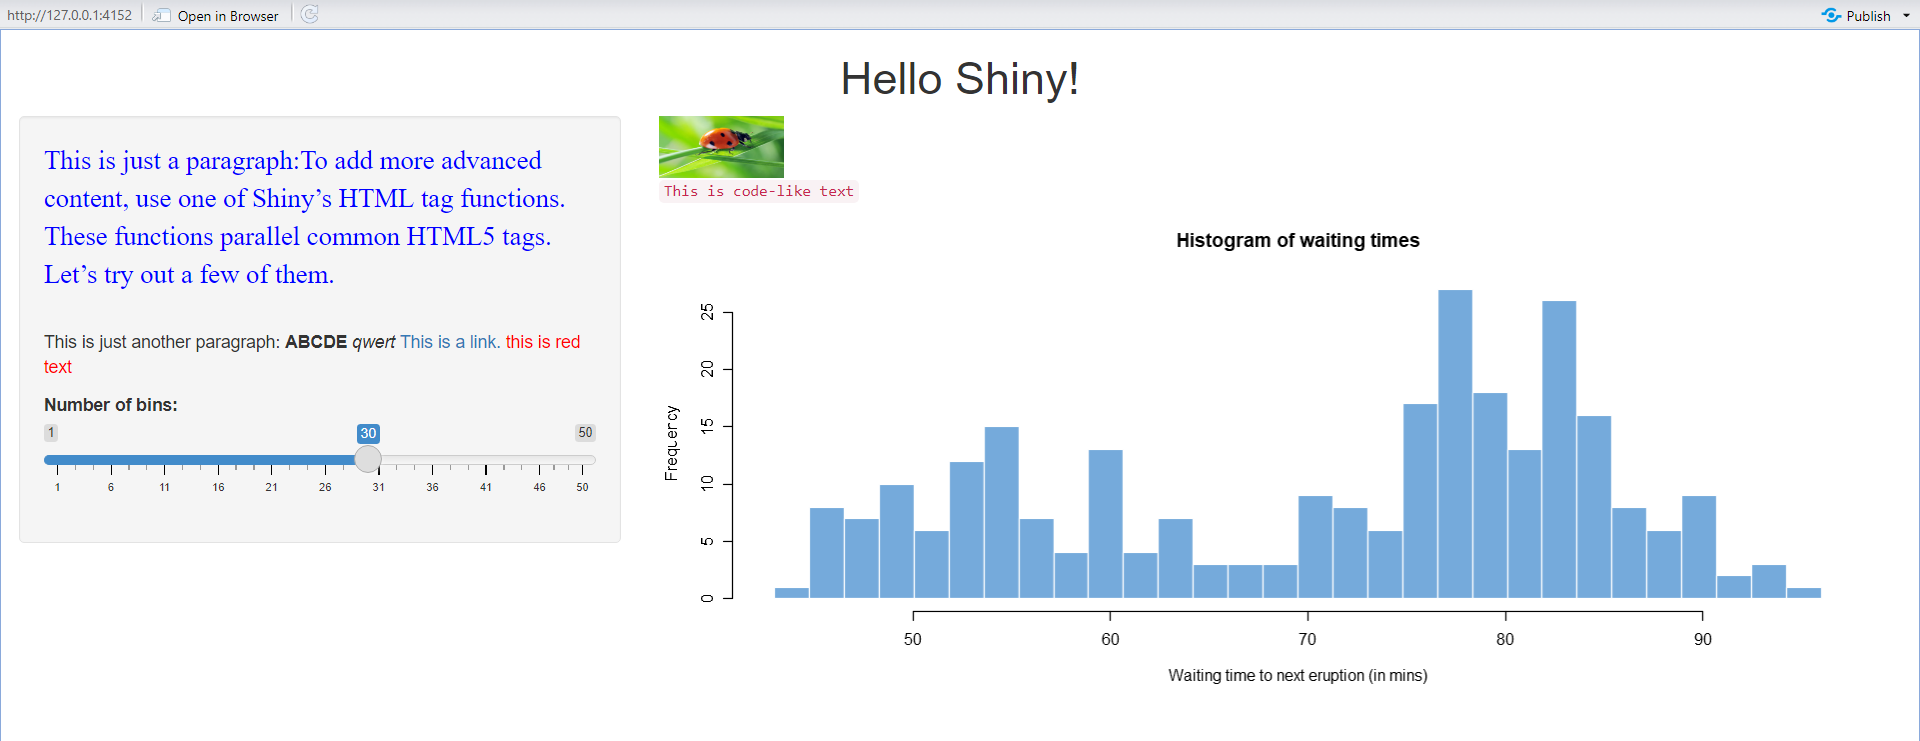
如下为一个示例
 1
 2
 3
 4
 5
 6
 7
 8
 9
10
11
12
13
14
15
16
17
18
19
20
21
22
23
24
25
26
27
28
29
30
31
32
33
34
35
36
37
38
39
40
41
42
|
library(shiny)
ui <- fluidPage(
  titlePanel(h1("Hello Shiny!", align="center")),

  sidebarLayout(
    sidebarPanel(
      p("This is just a paragraph:To add more advanced content,
        use one of Shiny’s HTML tag functions. These functions parallel
        common HTML5 tags. Let’s try out a few of them.",
        style = "font-family: 'times'; font-size:16pt ; color:blue"),
      br(),
      p("This is just another paragraph:",
        strong("ABCDE"),em("qwert"),
        a("This is a link.", href = "http://baidu.com"),
        span("this is red text", style="color:red")),
      sliderInput(inputId = "bins",
                  label = "Number of bins:",
                  min = 1,
                  max = 50,
                  value = 30)
    ),

    mainPanel(
      img(src = "picture.png" , height = 50, width = 100),
      br(),
      code("This is code-like text"),
      plotOutput(outputId = "distPlot")
    )
  )
)

server <- function(input, output) {
  output$distPlot <- renderPlot({
    x    <- faithful$waiting
    bins <- seq(min(x), max(x), length.out = input$bins + 1)
    hist(x, breaks = bins, col = "#75AADB", border = "white",
         xlab = "Waiting time to next eruption (in mins)",
         main = "Histogram of waiting times")
  })
}

shinyApp(ui = ui, server = server)
|
5、加载其它数据#
如上在app.R脚本有3部分内容,分别是ui,server以及shinyApp()
由于特定的需求,在运行App前可能需要加载一些包、脚本或者数据,可以在app.R开头部分声明。
其中对于自定义脚本文件可放在与app.R同级的路径;对于数据,建议放在app.R同级的路径新建data文件夹内。
 1
 2
 3
 4
 5
 6
 7
 8
 9
10
11
12
13
14
15
16
17
18
19
20
|
# Load packages ----
library(shiny)
library(dplyr)

# Load data ----
dat1 <- readRDS("data/dat1.rds")
dat2 <- read.csv("data/dat2.csv")

# Source predefined functions scripts-----
source("function.R")

ui <- fluidPage(
  ...........
)

server <- function(input, output) {
  ...........
}

shinyApp(ui, server)
|
6、shiny server#
shiny server可将app发布到服务器到,分享给其他人使用。
前提是需要有服务器的ROOT权限,以下以ubuntu服务器操作为例。
6.1、安装shiny server#
- 参考:https://docs.rstudio.com/shiny-server/?_ga=2.30896886.831263136.1653093233-369539279.1626573788#host-a-directory-of-applications
简单来说:安装r-base → 安装shiny包 → 安装shiny Server
 1
 2
 3
 4
 5
 6
 7
 8
 9
10
11
12
13
14
15
16
17
18
19
20
21
22
23
24
25
26
27
28
29
30
31
32
|
##(1) 安装r-base
# update indices
apt update -qq
# install two helper packages we need
apt install --no-install-recommends software-properties-common dirmngr
# add the signing key (by Michael Rutter) for these repos
# To verify key, run gpg --show-keys /etc/apt/trusted.gpg.d/cran_ubuntu_key.asc
# Fingerprint: E298A3A825C0D65DFD57CBB651716619E084DAB9
wget -qO- https://cloud.r-project.org/bin/linux/ubuntu/marutter_pubkey.asc | sudo tee -a /etc/apt/trusted.gpg.d/cran_ubuntu_key.asc
# add the R 4.0 repo from CRAN -- adjust 'focal' to 'groovy' or 'bionic' as needed
add-apt-repository "deb https://cloud.r-project.org/bin/linux/ubuntu $(lsb_release -cs)-cran40/"

apt install --no-install-recommends r-base
add-apt-repository ppa:c2d4u.team/c2d4u4.0+

##(2) 安装shiny包
#准备编译环境
sudo apt-get install build-essential
sudo apt-get install libz-dev
#设置镜像
vi ~/.Rprofile
#options(repos=structure(c(CRAN="https://mirrors.tuna.tsinghua.edu.cn/CRAN/")))
#options(BioC_mirror="https://mirrors.tuna.tsinghua.edu.cn/bioconductor")

#安装R包
R
# install.packages("shiny")

##(3) 安装 shiny server
sudo apt-get install gdebi-core
wget https://download3.rstudio.org/ubuntu-18.04/x86_64/shiny-server-1.5.18.987-amd64.deb
sudo gdebi shiny-server-1.5.18.987-amd64.deb
|
2、启动shiny server#
 1
 2
 3
 4
 5
 6
 7
 8
 9
10
11
12
13
14
15
16
17
18
19
20
21
22
23
24
25
26
27
28
29
30
31
32
33
34
35
36
37
38
39
40
41
42
43
44
45
46
47
48
49
50
51
52
|
##(1) 查看config配置文件
cat /etc/shiny-server/shiny-server.conf
## 如下可以看到默认端口为 3838, 可自定义修改;需要确保服务器开放了这一端口(防火墙管理)
# # Instruct Shiny Server to run applications as the user "shiny"
# run_as shiny;
#
# # Define a server that listens on port 3838
# server {
#   listen 3838;
#
#   # Define a location at the base URL
#   location / {
#
#     # Host the directory of Shiny Apps stored in this directory
#     site_dir /srv/shiny-server;
#
#     # Log all Shiny output to files in this directory
#     log_dir /var/log/shiny-server;
#
#     # When a user visits the base URL rather than a particular application,
#     # an index of the applications available in this directory will be shown.
#     directory_index on;
#   }
# }

##(2) 查看app脚本文件
tree /srv/shiny-server/
#/srv/shiny-server/
#├── index.html -> /opt/shiny-server/samples/welcome.html
#└── sample-apps -> /opt/shiny-server/samples/sample-apps
tree /opt/shiny-server/samples/
#/opt/shiny-server/samples/
#├── sample-apps
#│   ├── hello
#│   │   ├── server.R
#│   │   └── ui.R
#│   └── rmd
#│       └── index.Rmd
#└── welcome.html

##(3) 启动 shiny server服务
sudo systemctl start shiny-server   #启动
sudo systemctl status shiny-server  #查看状态

sudo systemctl stop shiny-server    #停止
sudo systemctl restart shiny-server #重启

##(4) 查看shiny网页
#只需将自己的shiny项目文件夹放置在/srv/shiny-server/目录下即可
#以下是我的试验服务器,仅做用法演示。
# /srv/shiny-server/index.html        ---→  http://124.222.37.114:3838/
# /srv/shiny-server/sample-apps/hello ---→  http://124.222.37.114:3838/sample-apps/hello
|