Github tutorial:https://github.com/const-ae/ggsignif

1
2
library(ggplot2)
library(ggsignif)
  • 1、
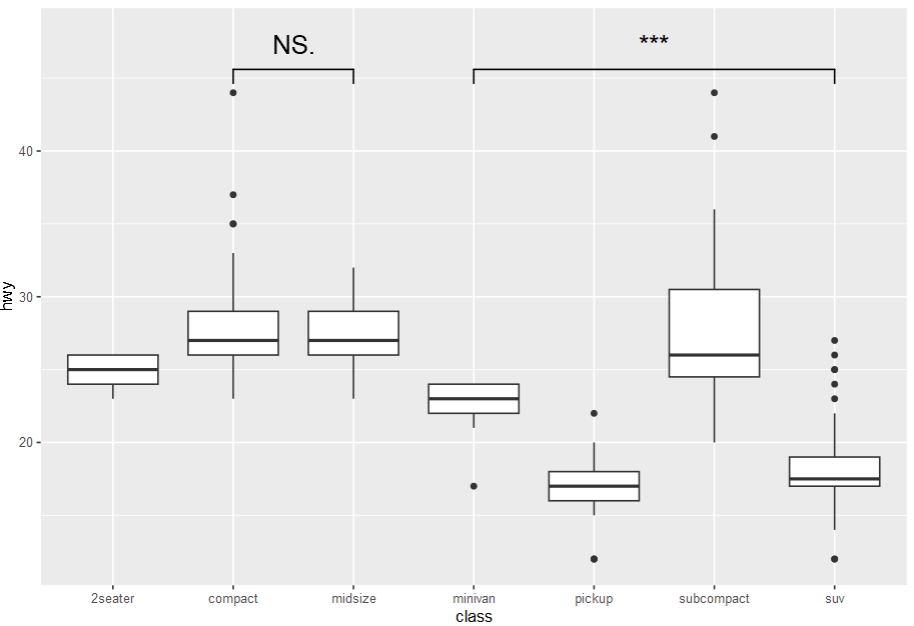
comparisons设置分组,计算并标注P值
 1
 2
 3
 4
 5
 6
 7
 8
 9
10
11
12
13
14
ggplot(mpg, aes(class, hwy)) +
  geom_boxplot() +
  geom_signif(
    comparisons = list(c("compact", "midsize"), 
    				   c("minivan", "suv")),
    map_signif_level = TRUE, textsize = 6,
    test = "t.test",  # c("wilcox.test","t.test")
    vjust = -0.5 # 标签相对位置
  ) +
  ylim(NA, 48)

# map_signif_level: 将P值映射为等级
# test: 设置差异分析方法
# size、textsize分别设置线与标签的颜色
image-20230422092438688
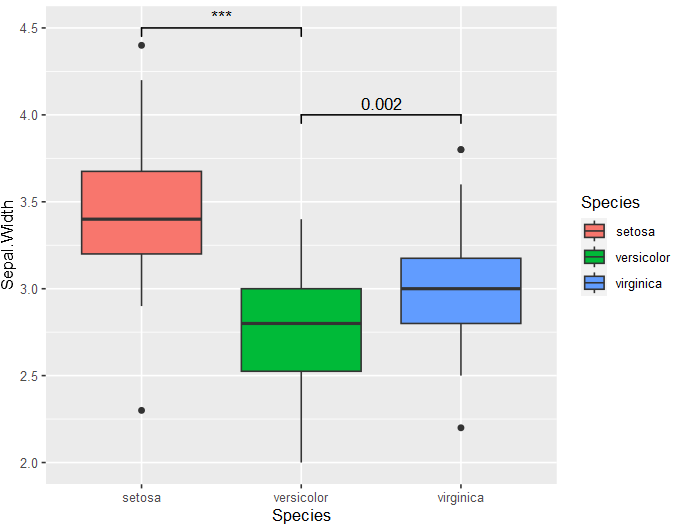
  • annotation直接交代P值/标签,手动设置
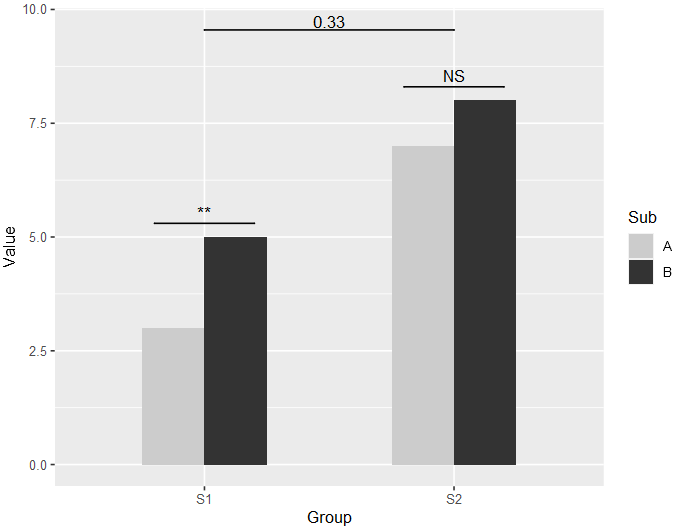
 1
 2
 3
 4
 5
 6
 7
 8
 9
10
11
12
13
anno <- t.test(
  iris$Sepal.Width[iris$Species=="versicolor"],
  iris$Sepal.Width[iris$Species == "virginica"]
)$p.value
# [1] 0.001819483

ggplot(iris, aes(x = Species, y = Sepal.Width, fill = Species)) +
  geom_boxplot(position = "dodge") +
  geom_signif(
    annotation = c(formatC(anno, digits = 1),"***"),
    y_position = c(4, 4.5), xmin = c(2,1), xmax = c(3,2), # 位置
    tip_length = 0.02,
  )
image-20230422092724964
  • 混合叠加多次注释
 1
 2
 3
 4
 5
 6
 7
 8
 9
10
11
ggplot(dat, aes(Group, Value)) +
  geom_bar(aes(fill = Sub), stat = "identity", position = "dodge", width = .5) +
  geom_signif(
    y_position = c(5.3, 8.3), xmin = c(0.8, 1.8), xmax = c(1.2, 2.2),
    annotation = c("**", "NS"), tip_length = 0
  ) +
  geom_signif(
    comparisons = list(c("S1", "S2")),
    y_position = 9.3, tip_length = 0, vjust = 0.2
  ) +
  scale_fill_manual(values = c("grey80", "grey20"))
image-20230422093043189