1
2
3
|
library(ggplot2)
# install.packages("ggbeeswarm")
library(ggbeeswarm)
|
 1
 2
 3
 4
 5
 6
 7
 8
 9
10
11
12
13
14
|
set.seed(1995)
y <- round(rnorm(200), 1)
df <- data.frame(y = y,
                group = sample(c("G1", "G2", "G3"),
                               size = 200,
                               replace = TRUE))
head(df)
#      y group
# 1  1.1    G3
# 2 -0.3    G2
# 3  0.1    G2
# 4  0.4    G1
# 5  1.7    G3
# 6 -0.3    G3
|
1
2
|
ggplot(df, aes(x = group, y = y)) +
  geom_beeswarm()
|
1
2
|
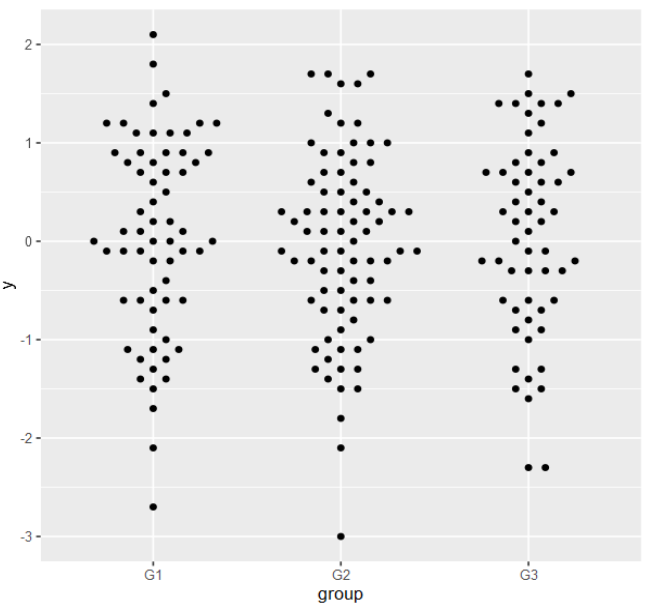
ggplot(df, aes(x = group, y = y)) +
  geom_beeswarm(cex = 3)
|
1
2
|
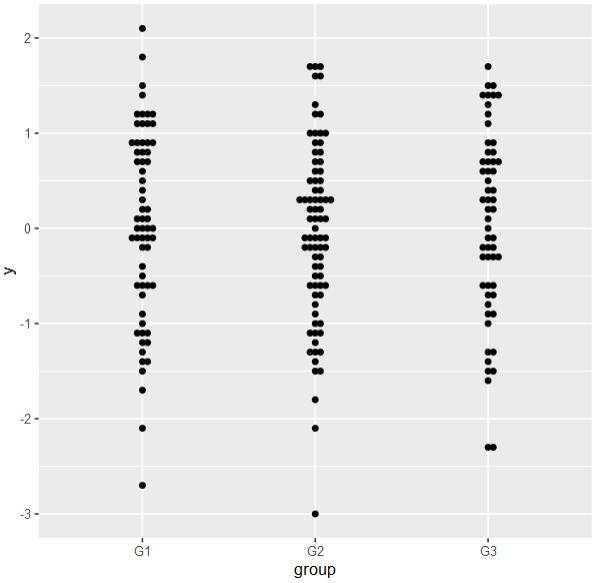
ggplot(df, aes(x = group, y = y)) +
  geom_beeswarm(priority = "descending")
|

此外side = c(0, -1, 1)参数可设置显示一侧的结果,具体可查看帮助文档
1
2
3
4
5
6
|
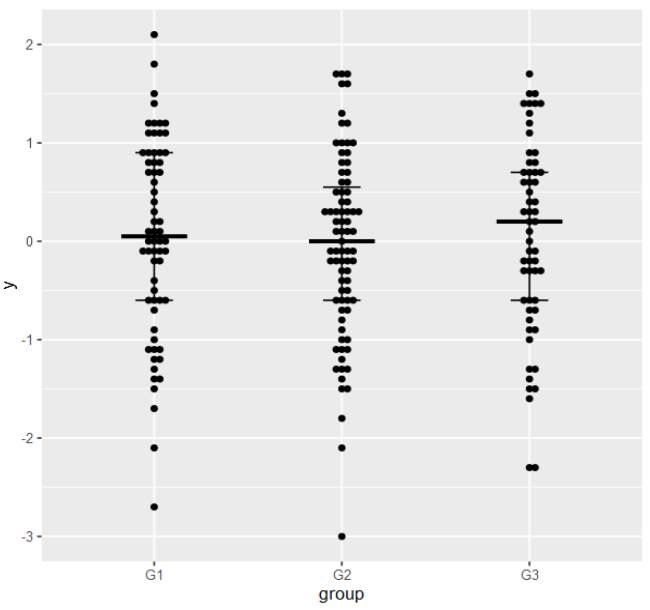
ggplot(df, aes(x = group, y = y)) +
  geom_beeswarm() +
  stat_summary(fun = median, fun.min = median, fun.max = median,
               geom = 'crossbar', width = 0.35, linewidth = 0.5, color = 'black') +
  stat_summary(fun.data = function(x) median_hilow(x, 0.5),
               geom = 'errorbar', width = 0.2, color = 'black')
|