1、ggplot#
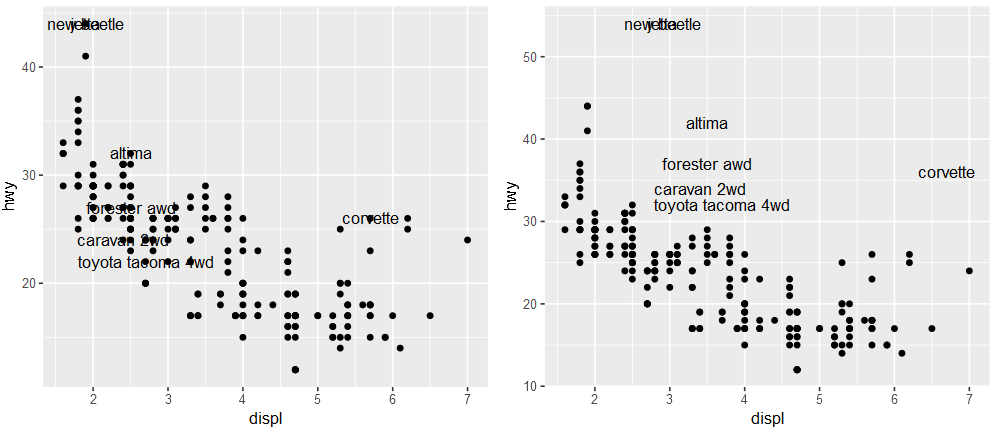
geom_text()通过交代文本的坐标位置与内容绘制,通常与点图联用。相关参数包括:
- color 标签的颜色
- alpha 标签的透明度
- check_overlap 若有重叠的标签则不显示,默认为False
 1
 2
 3
 4
 5
 6
 7
 8
 9
10
11
12
13
14
15
|
library(tidyverse)
library(patchwork)

p = ggplot(mpg, aes(displ, hwy)) + geom_point()
# 设置候选标签
best_in_class <- mpg %>%
  group_by(class) %>%
  filter(row_number(desc(hwy)) == 1)

# nudge_x / nudge_y:设置标签的相对位置,移动单位与x/y轴匹配;大于0分别表示右、上
# hjust / vjust:设置标签的相对位置,移动单位与自身长宽匹配;小于0分别表示右,上
p1 = p + geom_text(aes(label = model), data = best_in_class)
p2 = p + geom_text(aes(label = model), data = best_in_class,
                   nudge_x = 1, nudge_y = 10)
p1 | p2
|
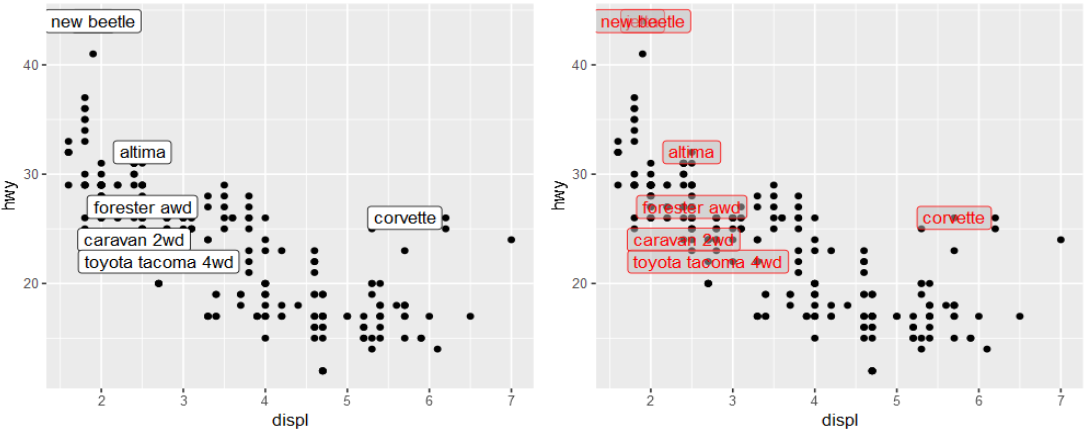
geom_label()在上述的基础上设置文本框,相关参数包括:
- label.size:框轮廓线的宽度
- label.r:框轮廓的平滑度
- label.padding:框的大小
- alpha:框的透明度
1
2
3
4
|
p1 = p + geom_label(aes(label = model), data = best_in_class)
p2 = p + geom_label(aes(label = model), data = best_in_class,
                    alpha=0.5, fill="grey", color="red")
p1 | p2
|
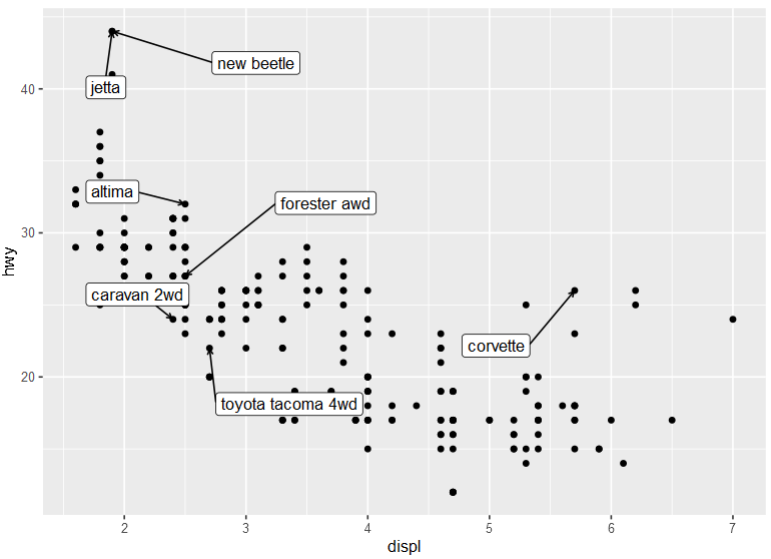
2、ggrepel#
上述函数对于重叠标签的处理能力有限,ggrepel包可对此进行有效的补充。简单理解就是确定文本标签的坐标后,对于存在互相重叠的标签进行适当偏移,使各自均能完整的显示。
geom_text_repel,部分参数与上相同
- max.overlaps:所允许的最多重叠数,若超过则显示
- box.padding:可以理解为设置标签与给定坐标的相对位置
- min.segment.length:在超过此长度后才显示连接线段
- arrow:设置箭头
1
2
3
4
5
6
|
library(ggrepel)
p1 = p + geom_text_repel(aes(label = model), data = best_in_class)
p2 = p + geom_text_repel(aes(label = model), data = best_in_class,
                         box.padding = 2, min.segment.length = 2,
                         arrow = arrow(length = unit(0.01, "npc")))
p1 | p2
|
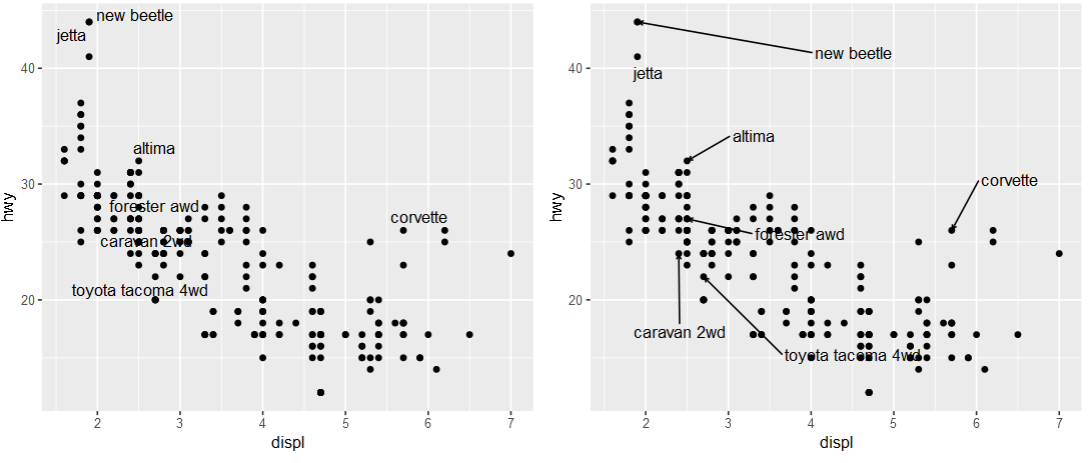
geom_label_repel(), 用法与上述基本一致