1
2
3
4
5
6
7
8
9
10
11
12
13
14
15
16
17
18
19
20
21
22
23
24
25
26
27
28
29
30
31
|
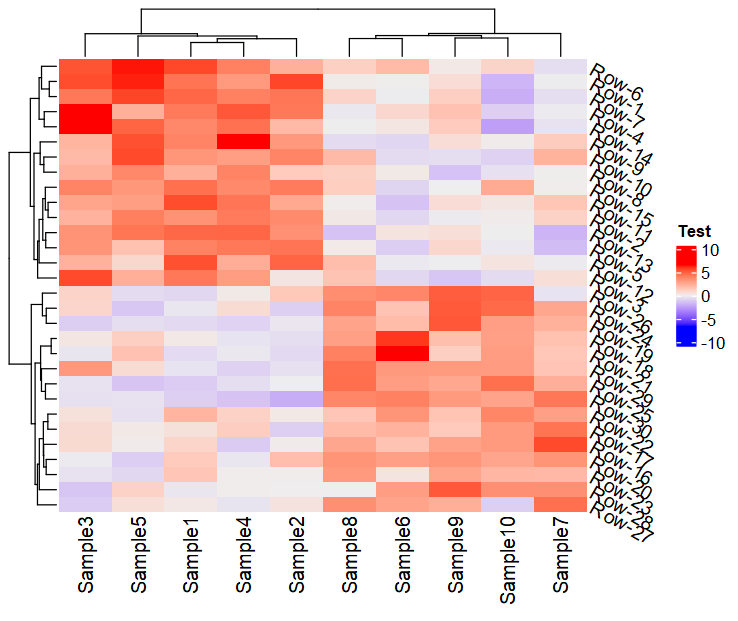
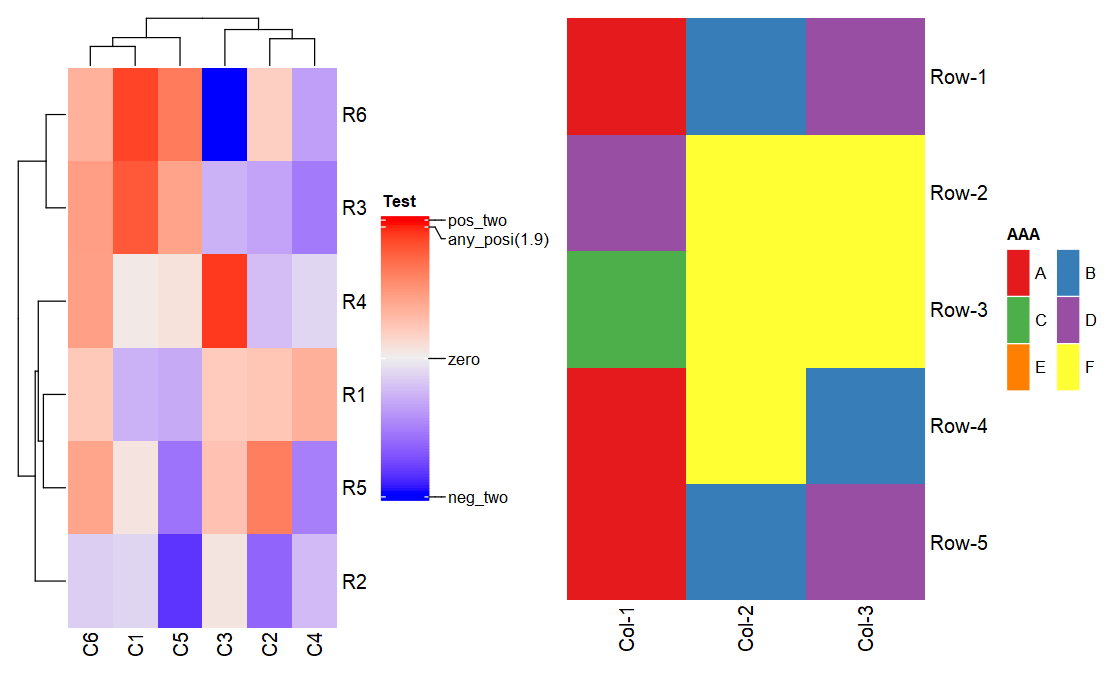
##(1) 连续变量legend
Heatmap(mat,
heatmap_legend_param = list(
col_fun = col_fun,
title = "Test", at = c(-2, 0, 1.9,2),
labels = c("neg_two", "zero", "any_posi(1.9)","pos_two"),
legend_height = unit(6, "cm"),
grid_width = unit(1, "cm"))
)
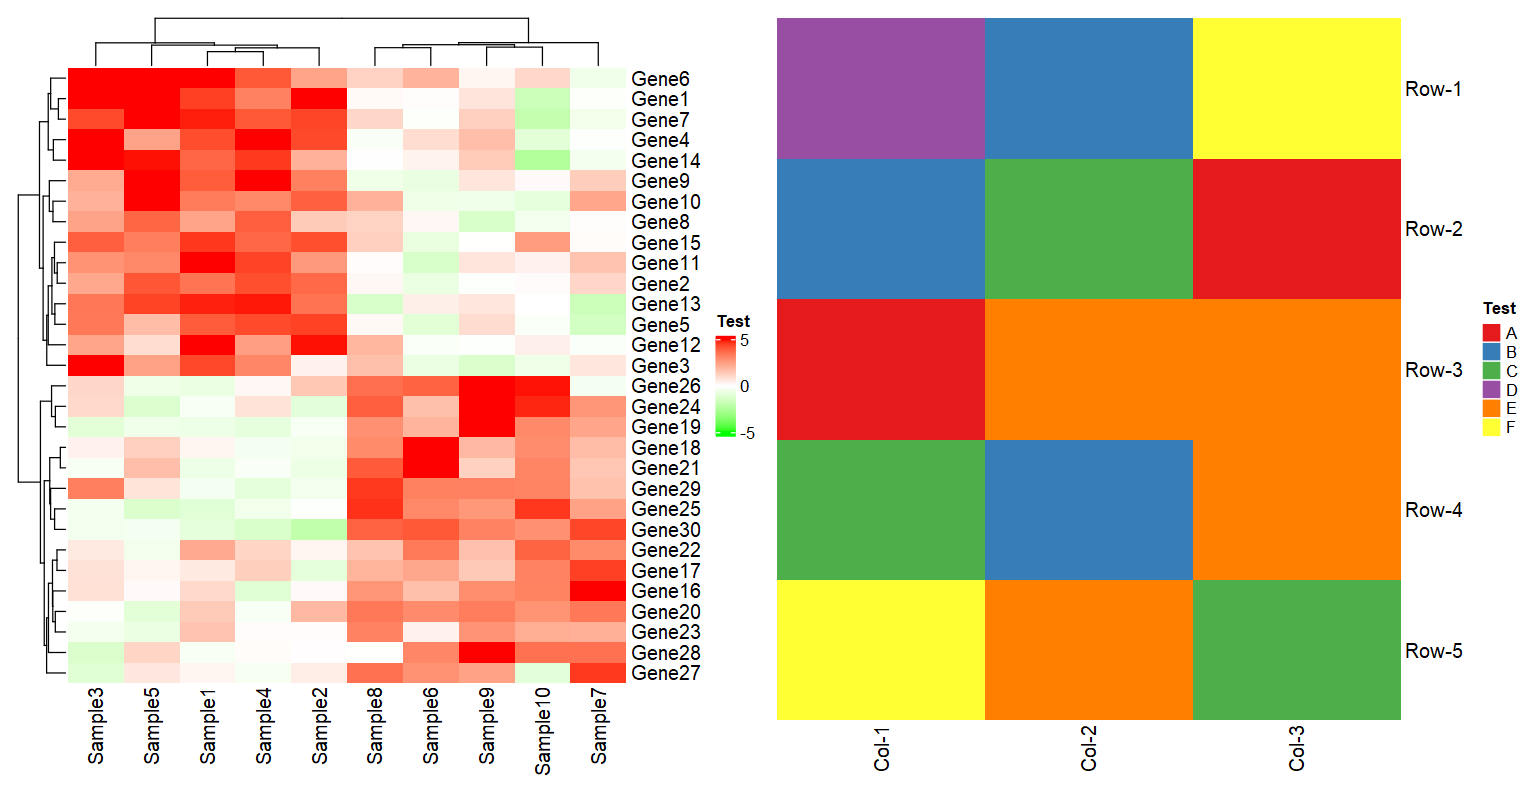
##(2) 离散变量legend
mat2 = matrix(sample(LETTERS[1:6], 15, replace = T),
nrow = 5, byrow = TRUE,
dimnames = list(c("Row-1","Row-2","Row-3","Row-4","Row-5"),
c("Col-1","Col-2","Col-3")))
colors = RColorBrewer::brewer.pal(n = 6, name = "Set1")
names(colors) = LETTERS[1:6]
colors
Heatmap(mat2, col = colors,
heatmap_legend_param = list(
title = "AAA",
at = LETTERS[1:6],
labels = LETTERS[1:6],
ncol = 2,
by_row = TRUE,
legend_gp = gpar(fill = colors),
grid_height = unit(1, "cm"),
grid_width = unit(5, "mm"),
row_gap = unit(1, "mm")
)
)
|