一、ggplot2组图
0、安装包及示例图
|
|
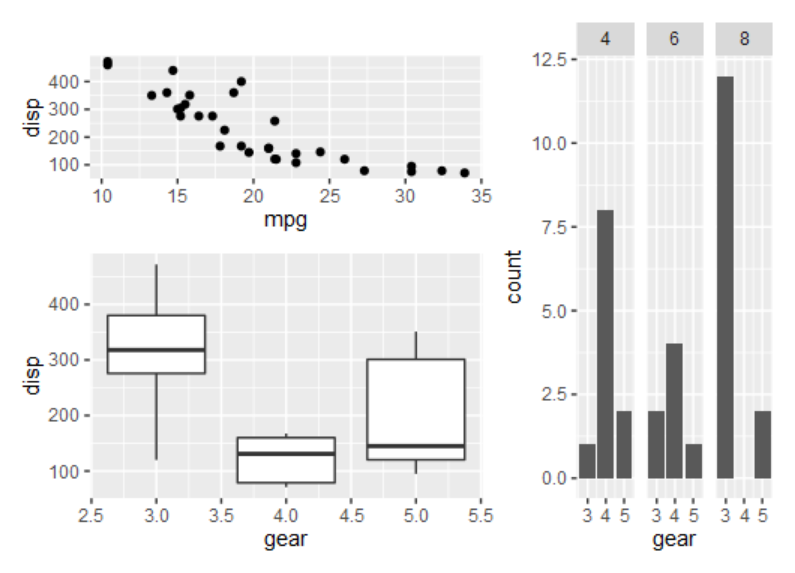
1、简单使用
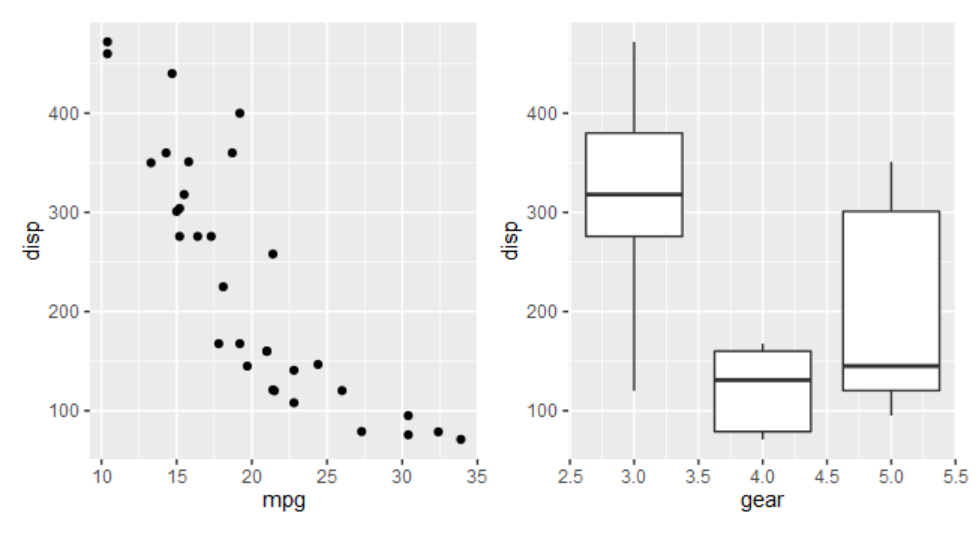
(1)符号连接:+或者| 均表示左右拼接,/表示上下拼接,()可以用于调整优先级
(2)函数调用:wrap_plots(),可通过具体参数设置排列方式
|
|
|
|
2、复杂排列
-
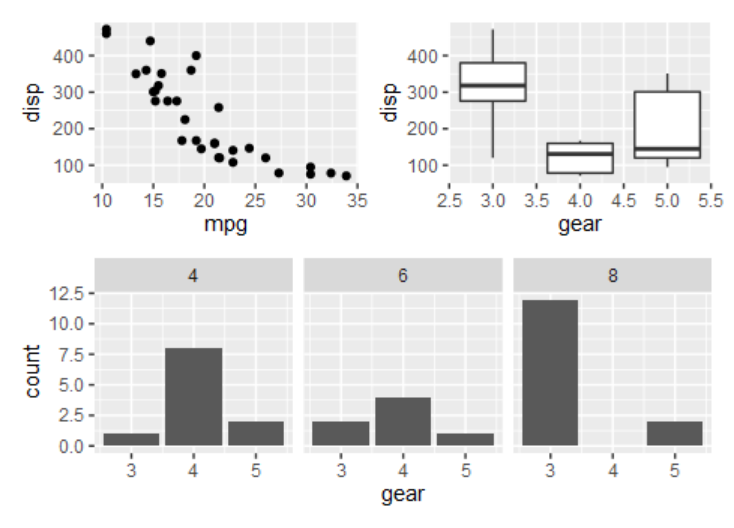
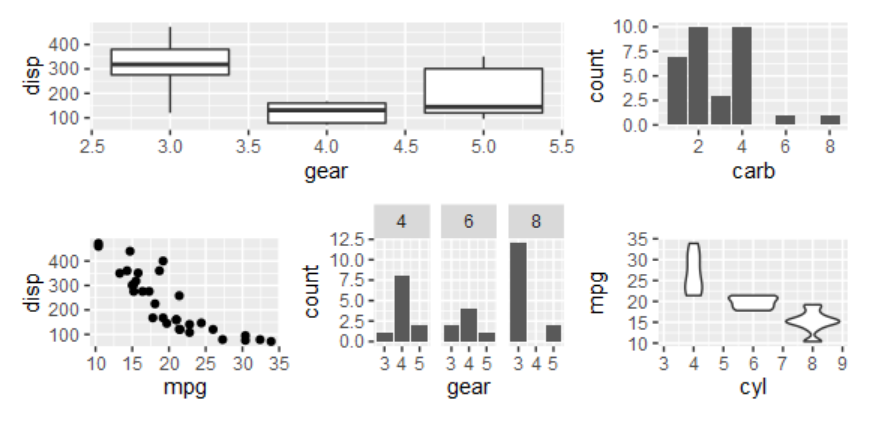
符号连接方式中,可使用
()调整优先级 -
函数调用方式中,可通过
design=参数设置
|
|
|
|
3、细节调整
plot_layout()调整长宽比例
|
|
plot_layout()相同legend
|
|
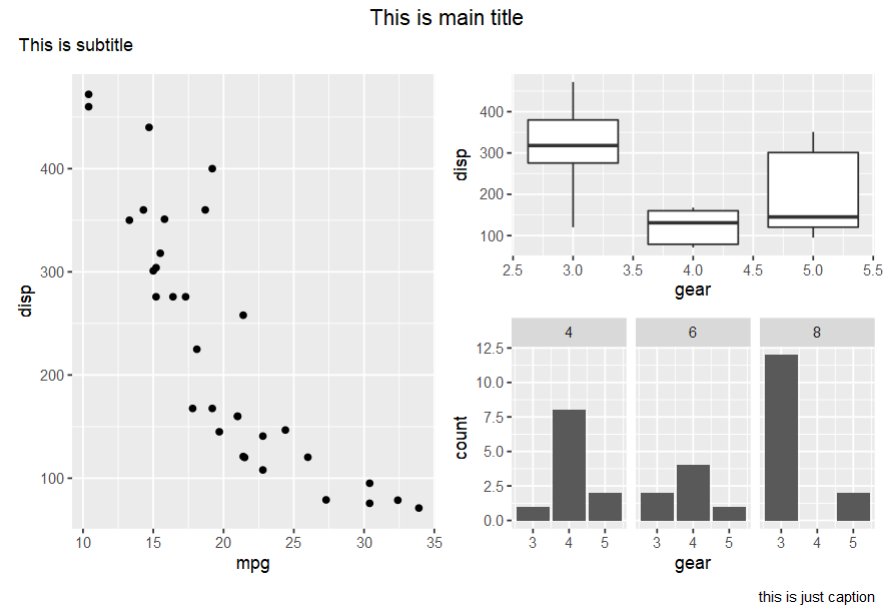
plot_annotation() 设置标题
|
|
plot_annotation() 设置子图tag标签
|
|
4、ggplot与其它对象的拼图
ggplot2与表格
|
|
ggplot2与基础绘图
|
|
二、R基本绘图组图
仅适用于R基础绘制图形的组图
|
|
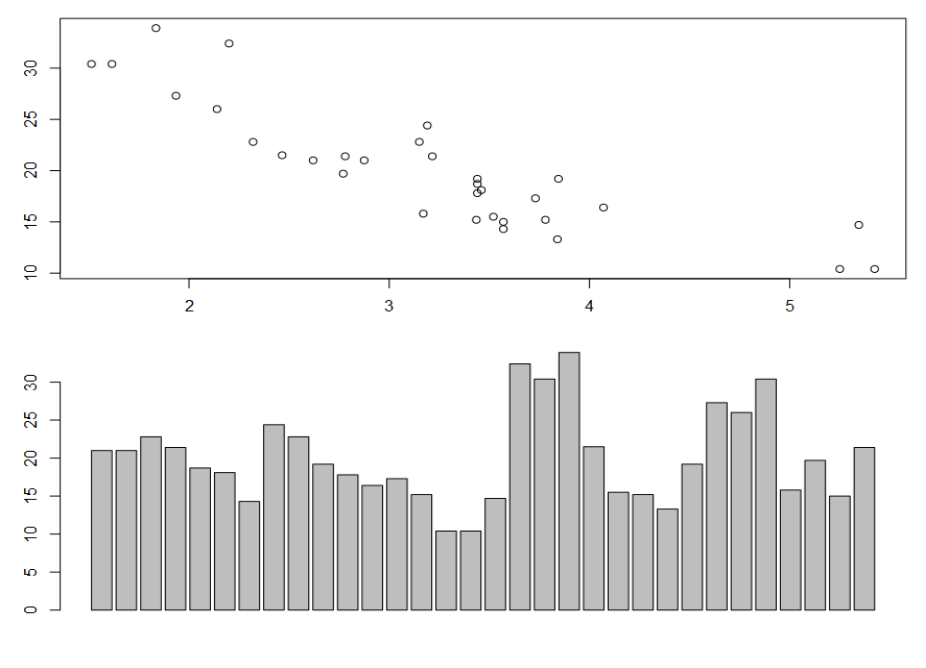
1、par()方式
mfcol=c(x,y)与mfrow=c(x,y)均是将初始绘图面板平均分割为x行,y列;- 二者区别在于前者按列的顺序依次填充、布局;而后者为按行依次填充、布局
|
|
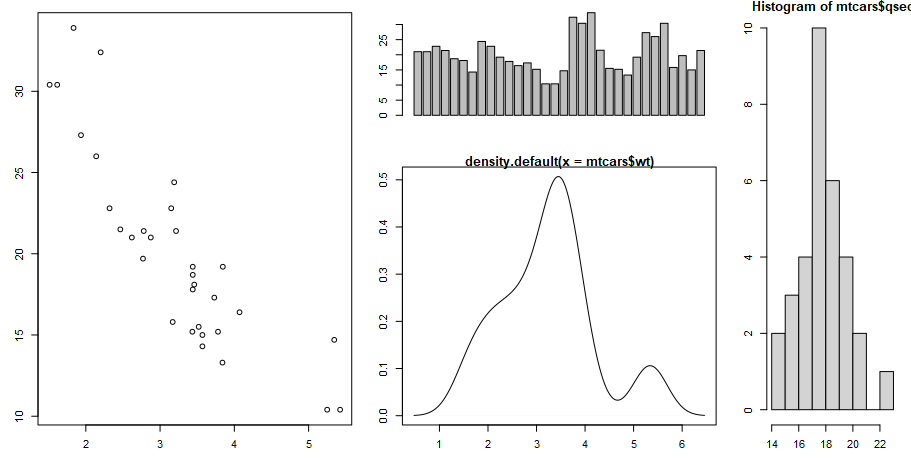
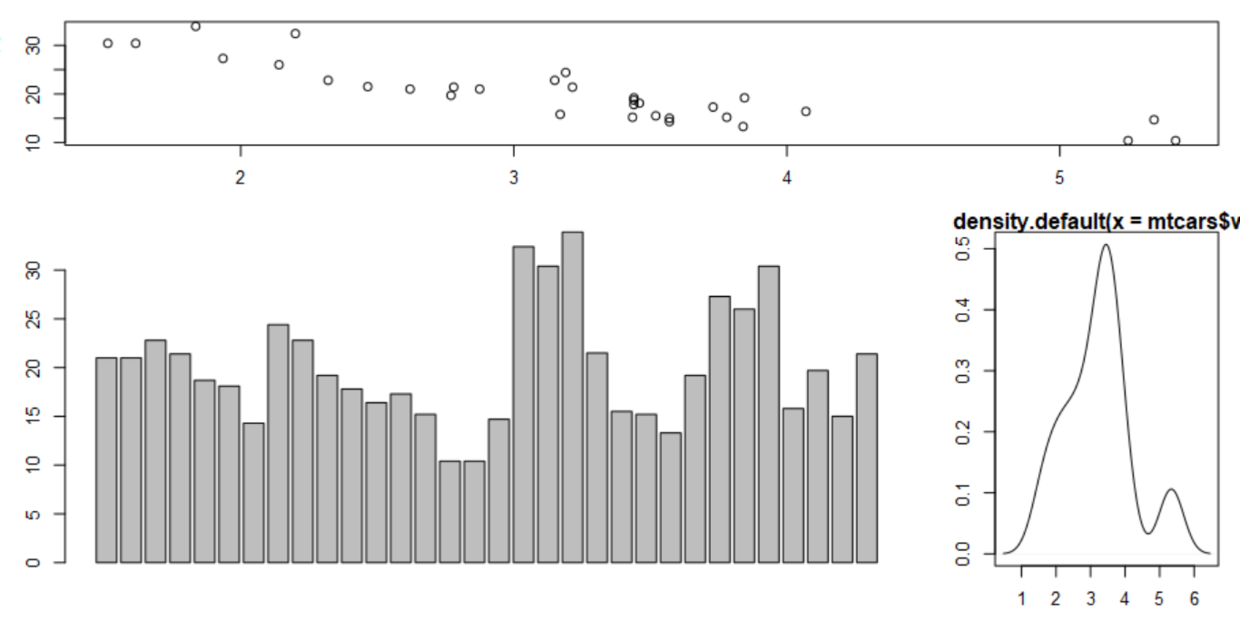
2、layout()精细布局
layout()函数的第一个参数为一个矩阵,用于设置组图位置
|
|
widths、heights参数可进一步设置子图间的长宽比例
|
|
|
|