目的:演示常见几种回归器的使用方法,对其超参数调优候选超参数的选择

0、示例数据

 1
 2
 3
 4
 5
 6
 7
 8
 9
10
11
12
from sklearn import datasets
from sklearn.model_selection import train_test_split
from sklearn.preprocessing import StandardScaler
from sklearn.model_selection import cross_val_score
from sklearn.model_selection import GridSearchCV

diabetes = datasets.load_diabetes()
diabetes_X, diabetes_y = diabetes.data, diabetes.target
diabetes_X = StandardScaler().fit_transform(diabetes_X)
train_X, test_X, train_y, test_y = train_test_split(diabetes_X, diabetes_y, test_size=0.3)
train_X.shape, test_X.shape, train_y.shape, test_y.shape
# ((309, 10), (133, 10), (309,), (133,))

1、K近邻

 1
 2
 3
 4
 5
 6
 7
 8
 9
10
11
12
13
from sklearn.neighbors import KNeighborsRegressor
model_knn = KNeighborsRegressor()
param_grid = {"n_neighbors": [3, 5, 7, 10, 20],
              "p": [1, 2],
              "weights": ["uniform", "distance"]}
grid_search = GridSearchCV(model_knn, param_grid, cv=5,
                           scoring="neg_root_mean_squared_error", n_jobs=-1)
grid_search.fit(train_X, train_y) 
print(grid_search.best_params_)
print(grid_search.best_score_)
knn_grid_search = grid_search
# {'n_neighbors': 10, 'p': 2, 'weights': 'distance'}
# -58.18148180421127

2、线性回归

1
2
3
4
5
6
7
from sklearn.linear_model import LinearRegression
model_linear = LinearRegression()
scores = cross_val_score(model_linear, train_X, train_y, 
						 scoring="neg_root_mean_squared_error", cv=10)
print(scores.mean())
linear_cv = scores
# -56.297486183914245

3、支持向量机

 1
 2
 3
 4
 5
 6
 7
 8
 9
10
11
12
13
14
15
16
from sklearn.svm import SVR
model_svm = SVR()
param_grid = [    
    {'C' : [0.01, 0.1, 1, 10, 100],
     'kernel' : ['linear', 'poly', 'rbf', 'sigmoid'],
     'gamma'  : ['scale','auto']
    }
]
grid_search = GridSearchCV(model_svm, param_grid, cv=5,
                           scoring="neg_root_mean_squared_error", n_jobs=1)
grid_search.fit(train_X, train_y)              
print(grid_search.best_params_)
print(grid_search.best_score_)
svm_grid_search = grid_search
# {'C': 1, 'gamma': 'scale', 'kernel': 'linear'}
# -56.48299266830155

4、随机森林

 1
 2
 3
 4
 5
 6
 7
 8
 9
10
11
12
13
14
15
16
17
18
## 随机森林
from sklearn.ensemble import RandomForestRegressor
model_rf = RandomForestRegressor()
param_grid = [    
    {'n_estimators' : [100, 200, 300, 500, 1000],
     'criterion' : ["squared_error", "absolute_error"],  #与分类任务有变化
     'max_depth'  : [4, 8, 16, 32],
     'max_features' : ["sqrt", "log2"]
    }
]
grid_search = GridSearchCV(model_rf, param_grid, cv=5,
                           scoring="neg_root_mean_squared_error", n_jobs=10)
grid_search.fit(train_X, train_y)              
print(grid_search.best_params_)
print(grid_search.best_score_)
rf_grid_search = grid_search
# {'criterion': 'squared_error', 'max_depth': 4, 'max_features': 'sqrt', 'n_estimators': 500}
# -56.98892728898064

5、梯度增加机

 1
 2
 3
 4
 5
 6
 7
 8
 9
10
11
12
13
14
15
16
17
from sklearn.ensemble import GradientBoostingRegressor
model_gbm = GradientBoostingRegressor()
param_grid = [    
    {'loss' : ['squared_error', 'absolute_error', 'huber', 'quantile'], #与分类任务有变化
     'learning_rate' : [0.001, 0.01, 0.1],
     'n_estimators' : [100, 200, 300, 500],
     'subsample'  : [0.5, 0.7, 1]
    }
]
grid_search = GridSearchCV(model_gbm, param_grid, cv=5,
                           scoring="neg_root_mean_squared_error", n_jobs=10)
grid_search.fit(train_X, train_y)              
print(grid_search.best_params_)
print(grid_search.best_score_)
gbm_grid_search = grid_search
# {'learning_rate': 0.01, 'loss': 'absolute_error', 'n_estimators': 500, 'subsample': 0.5}
# -57.07526918837941

6、XGBoost

 1
 2
 3
 4
 5
 6
 7
 8
 9
10
11
12
13
14
15
16
17
from xgboost import XGBRegressor
model_xgb = XGBRegressor()
param_grid = [    
    {'n_estimators' : [10,  30, 50],
     'learning_rate' : [0.01, 0.1],
     'subsample'  : [0.5, 0.7, 1],
     'colsample_bytree' : [0.5, 0.7, 1]
    }
]
grid_search = GridSearchCV(model_xgb, param_grid, cv=5,
                           scoring="neg_root_mean_squared_error", n_jobs=10)
grid_search.fit(train_X, train_y)              
print(grid_search.best_params_)
print(grid_search.best_score_)
xgb_grid_search = grid_search
# {'colsample_bytree': 0.5, 'learning_rate': 0.1, 'n_estimators': 50, 'subsample': 0.5}
# -58.57262307535045

简单比较

1
2
3
4
5
6
7
8
9
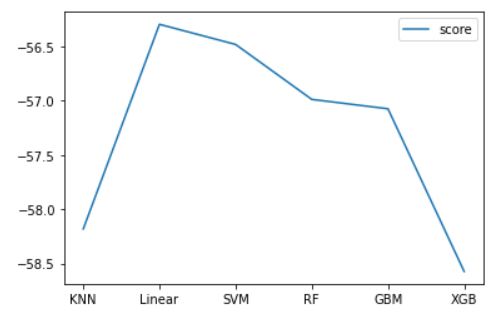
import pandas as pd
pd.DataFrame({
    "KNN" : knn_grid_search.best_score_,
    "Linear" : linear_cv.mean(),
    "SVM" : svm_grid_search.best_score_,
    "RF" : rf_grid_search.best_score_,
    "GBM" : gbm_grid_search.best_score_,
    "XGB" : xgb_grid_search.best_score_
}, index=["score"]).T.plot.line()

image-20220904181725895