1、逻辑回归的算法理解

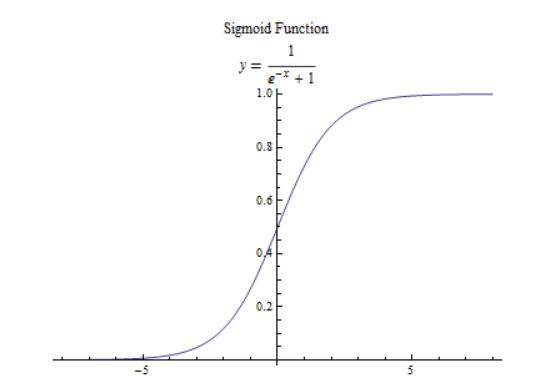
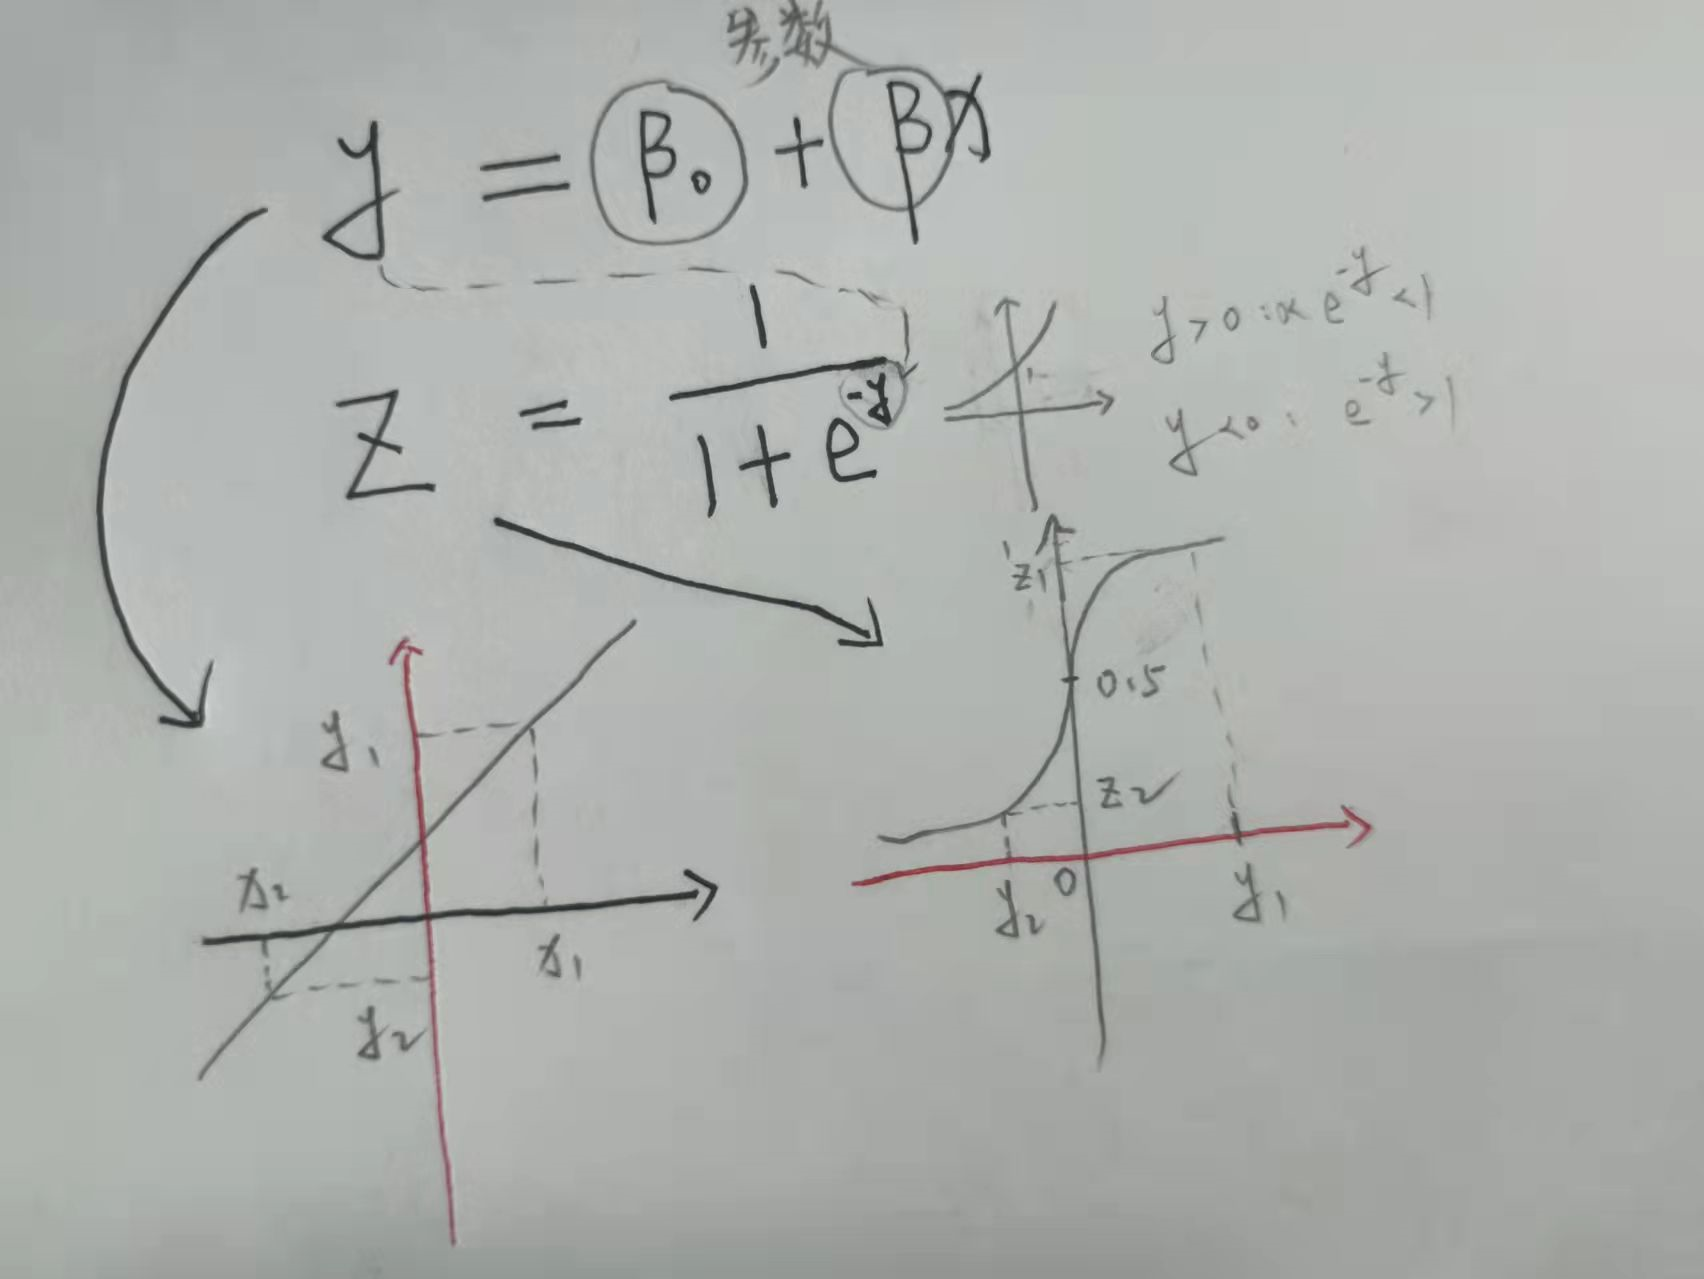
  • 逻辑回归 = 线性回归 + Sigmoid函数

img

  • 与线性回归相同的是同样需要学习变量的权重(系数)与偏置(截距);与线性回归不同的是逻辑回归的输出必须限制在0和1之间,即解释为概率(二分类)。
  • 一般来说:P>0.5,分类为1,P<0.5分类为0
image-20220401171633594

2、mlr建模

1
2
library(mlr3verse)
library(tidyverse)

2.1 泰坦尼克号示例数据

 1
 2
 3
 4
 5
 6
 7
 8
 9
10
11
12
13
14
15
16
17
18
19
data(titanic_train, package = "titanic")
titanicSub = titanic_train[,c("Survived","Sex","Pclass",
                                "Age","Fare","SibSp","Parch")]
summary(titanicSub)
# Survived          Sex                Pclass           Age             Fare            SibSp           Parch       
# Min.   :0.0000   Length:891         Min.   :1.000   Min.   : 0.42   Min.   :  0.00   Min.   :0.000   Min.   :0.0000  
# 1st Qu.:0.0000   Class :character   1st Qu.:2.000   1st Qu.:20.12   1st Qu.:  7.91   1st Qu.:0.000   1st Qu.:0.0000  
# Median :0.0000   Mode  :character   Median :3.000   Median :28.00   Median : 14.45   Median :0.000   Median :0.0000  
# Mean   :0.3838                      Mean   :2.309   Mean   :29.70   Mean   : 32.20   Mean   :0.523   Mean   :0.3816  
# 3rd Qu.:1.0000                      3rd Qu.:3.000   3rd Qu.:38.00   3rd Qu.: 31.00   3rd Qu.:1.000   3rd Qu.:0.0000  
# Max.   :1.0000                      Max.   :3.000   Max.   :80.00   Max.   :512.33   Max.   :8.000   Max.   :6.0000

# 第一列:生存与否0/1
# 第二列:性别
# 第三列:头等舱、二等舱、三等舱 1/2/3
# 第四列:年龄
# 第五列:票价
# 第六列:兄弟姐妹+配偶人数
# 第七列:父母和孩子总人数
  • 数据预处理
 1
 2
 3
 4
 5
 6
 7
 8
 9
10
11
12
13
14
15
16
#删除含有缺失值的行
titanicSub = na.omit(titanicSub)

#对于分类变量因子化
titanicSub$Survived = factor(titanicSub$Survived)
titanicSub$Sex = factor(titanicSub$Sex)
titanicSub$Pclass = factor(titanicSub$Pclass)

head(titanicSub)
#   Survived    Sex Pclass Age    Fare SibSp Parch
# 1        0   male      3  22  7.2500     1     0
# 2        1 female      1  38 71.2833     1     0
# 3        1 female      3  26  7.9250     0     0
# 4        1 female      1  35 53.1000     1     0
# 5        0   male      3  35  8.0500     0     0
# 7        0   male      1  54 51.8625     0     0

2.2 确定预测目标与训练方法

  • (1)确定预测目的:根据5个变量Pclass,Sex ,Age,Fare 以及FamSize预测是否会生存
1
2
3
task_classif = as_task_classif(titanicSub, target = "Survived")
task_classif$col_roles$stratum = "Survived"
task_classif$col_roles
  • (2)确定预测方法:使用逻辑回归算法,无可调超参数
1
2
3
#设置predict.type参数为"prob",则预测输出不仅仅是分类变量,还有概率值
learner = lrn("classif.log_reg", predict_type = "prob")
learner$param_set

2.3 模型训练、预测

 1
 2
 3
 4
 5
 6
 7
 8
 9
10
11
12
13
14
15
16
17
18
19
20
21
22
#使用训练集训练模型
split = partition(task_classif, ratio = 0.6, stratify = T)
learner$train(task_classif, row_ids = split$train)
#使用测试集预测模型
prediction = learner$predict(task_classif, row_ids = split$test)
prediction$confusion
#         truth
# response   0   1
#        0 138  36
#        1  32  80
as.data.table(prediction) %>% head
#    row_ids truth response    prob.0     prob.1
# 1:       1     0        0 0.9240149 0.07598510
# 2:      17     0        1 0.4895318 0.51046818
# 3:      28     0        0 0.7318201 0.26817990

##对于二分类问题可以查看AUC值等指标
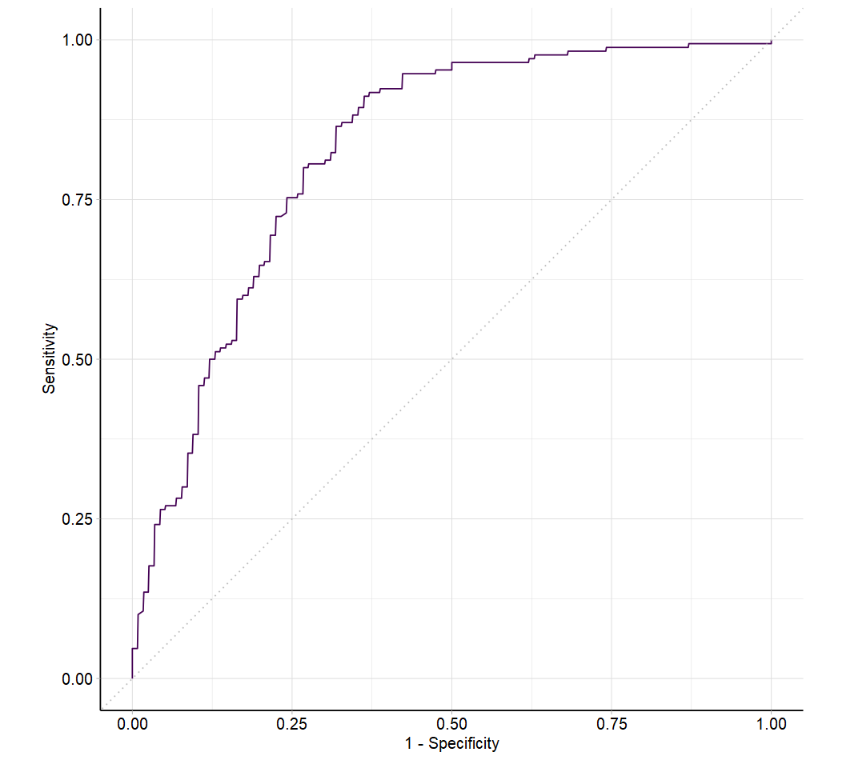
prediction$score(msrs(c("classif.acc","classif.auc")))
#classif.acc classif.auc 
#  0.7622378   0.8245436 

autoplot(prediction, type = "roc")
image-20220701132152087
  • 理解模型的系数
 1
 2
 3
 4
 5
 6
 7
 8
 9
10
11
12
13
14
15
16
17
18
learner$model$coefficients
# (Intercept)          Age         Fare        Parch      Pclass2      Pclass3      Sexmale        SibSp 
# -4.776866553  0.055414781 -0.001065547 -0.024478041  1.081818050  2.554926703  3.027348240  0.481382618 

#指数转换
exp(cbind(Odds_Ratio = learner$model$coefficients))
#               Odds_Ratio
# (Intercept)  0.008422349
# Age          1.056978939
# Fare         0.998935021
# Parch        0.975819117
# Pclass2      2.950037995
# Pclass3     12.870356259
# Sexmale     20.642421208
# SibSp        1.618310361

#对于连续变量的解释:例如Age:表示其它变量不变,每Age增长1岁,生存率降低1%
#对于分类变量的解释,需要有参照:例如Sexmale:表示男性的生存率仅为女性的20%
  • 模型预测
 1
 2
 3
 4
 5
 6
 7
 8
 9
10
11
12
13
14
15
16
17
18
19
data(titanic_test, package = "titanic")
#无生存信息
titanicNewClean = titanic_test[,c("Sex","Pclass",
                                  "Age","Fare","SibSp","Parch")]
titanicNewClean = na.omit(titanicNewClean)
titanicNewClean$Sex = factor(titanicNewClean$Sex)
titanicNewClean$Pclass = factor(titanicNewClean$Pclass)


learner$predict_newdata(titanicNewClean)
# <PredictionClassif> for 331 observations:
#     row_ids truth response     prob.0     prob.1
#           1  <NA>        0 0.92308299 0.07691701
#           2  <NA>        0 0.61325375 0.38674625
#           3  <NA>        0 0.92323646 0.07676354
# ---                                             
#         329  <NA>        1 0.35533044 0.64466956
#         330  <NA>        1 0.04779831 0.95220169
#         331  <NA>        0 0.93389621 0.06610379

2.4 交叉验证模型

  • 10次重复的5折交叉验证
 1
 2
 3
 4
 5
 6
 7
 8
 9
10
11
12
13
14
15
16
17
18
19
20
21
22
23
24
25
26
27
28
29
30
31
32
33
34
35
36
37
38
resampling = rsmp("repeated_cv")
resampling$param_set$values$repeats = 5
resampling$param_set$values$folds = 5

rr$prediction()
rr$score(msr("classif.auc"))[,c(-1,-3,-5,-8)]
#        task_id      learner_id resampling_id iteration classif.auc
#  1: titanicSub classif.log_reg   repeated_cv         1   0.8539554
#  2: titanicSub classif.log_reg   repeated_cv         2   0.8385396
#  3: titanicSub classif.log_reg   repeated_cv         3   0.8392495
#  4: titanicSub classif.log_reg   repeated_cv         4   0.8678499
#  5: titanicSub classif.log_reg   repeated_cv         5   0.8663793
#  6: titanicSub classif.log_reg   repeated_cv         6   0.8709939
#  7: titanicSub classif.log_reg   repeated_cv         7   0.8847870
#  8: titanicSub classif.log_reg   repeated_cv         8   0.8330629
#  9: titanicSub classif.log_reg   repeated_cv         9   0.8314402
# 10: titanicSub classif.log_reg   repeated_cv        10   0.8467775
# 11: titanicSub classif.log_reg   repeated_cv        11   0.7981744
# 12: titanicSub classif.log_reg   repeated_cv        12   0.8308316
# 13: titanicSub classif.log_reg   repeated_cv        13   0.8947262
# 14: titanicSub classif.log_reg   repeated_cv        14   0.8658215
# 15: titanicSub classif.log_reg   repeated_cv        15   0.8723317
# 16: titanicSub classif.log_reg   repeated_cv        16   0.8669371
# 17: titanicSub classif.log_reg   repeated_cv        17   0.8277890
# 18: titanicSub classif.log_reg   repeated_cv        18   0.8336714
# 19: titanicSub classif.log_reg   repeated_cv        19   0.8377282
# 20: titanicSub classif.log_reg   repeated_cv        20   0.8955255
# 21: titanicSub classif.log_reg   repeated_cv        21   0.8566937
# 22: titanicSub classif.log_reg   repeated_cv        22   0.8292089
# 23: titanicSub classif.log_reg   repeated_cv        23   0.9101420
# 24: titanicSub classif.log_reg   repeated_cv        24   0.7997972
# 25: titanicSub classif.log_reg   repeated_cv        25   0.8844417

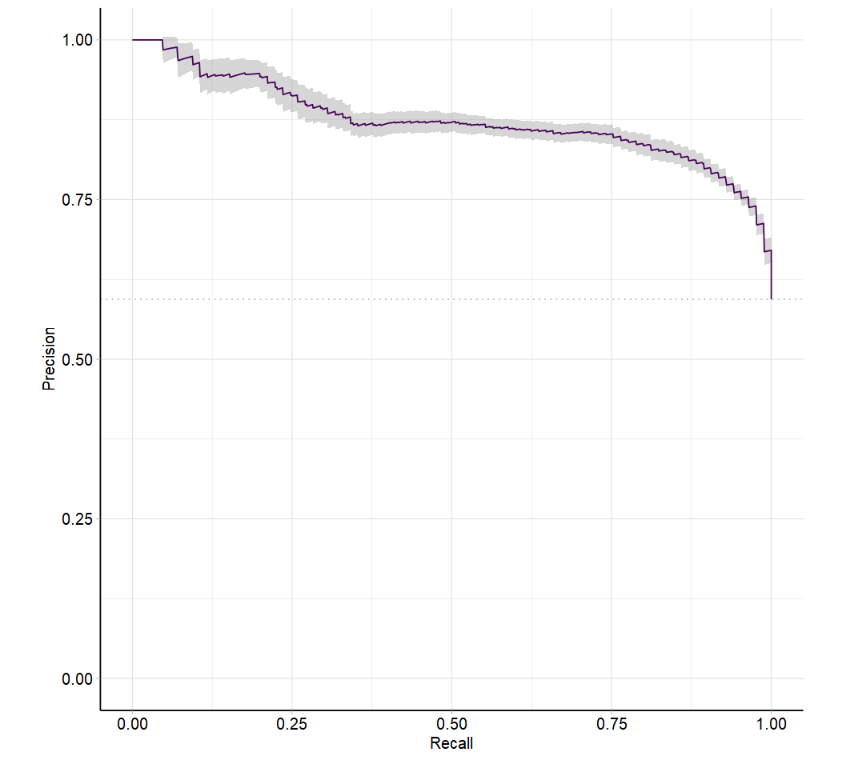
rr$aggregate(msrs(c("classif.auc","classif.prauc")))
# classif.auc classif.prauc 
#   0.8534742     0.8735251 

autoplot(rr, type = "prc")
image-20220701134748760