EnhancedVolcano包可根据差异分析结果,基于ggplot2绘图结构,方便地绘制美观的火山图,下面根据自己的理解小结下基本用法。
- 官方全面的教程:https://github.com/kevinblighe/EnhancedVolcano
示例差异基因数据
|
|
如上,只要包含包含
基因名、差异倍数、P值三部分信息的差异结果就可以用于绘制火山图。
- 安装、加载包
|
|
基本绘制
如下代码,需要分别交代基因名;x轴为差异倍数;y轴为P值
|
|
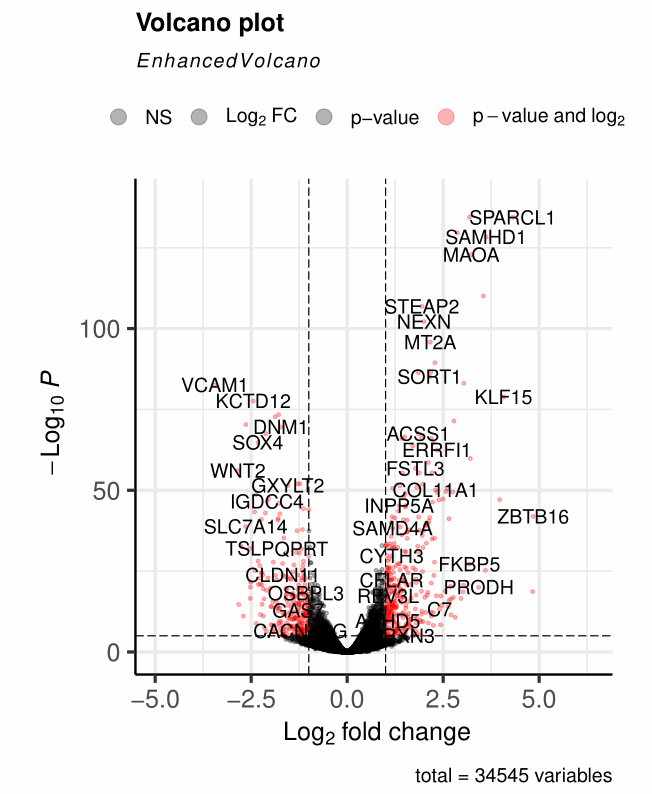
如下图结果,基本绘制了不错的火山图。
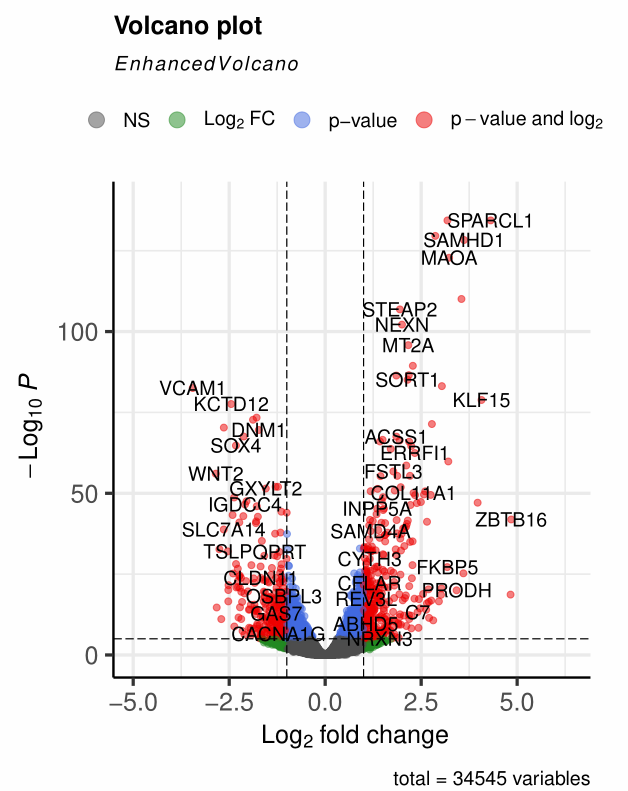
EnhancedVolcano()也提供了很多调整的参数,可供优化选择
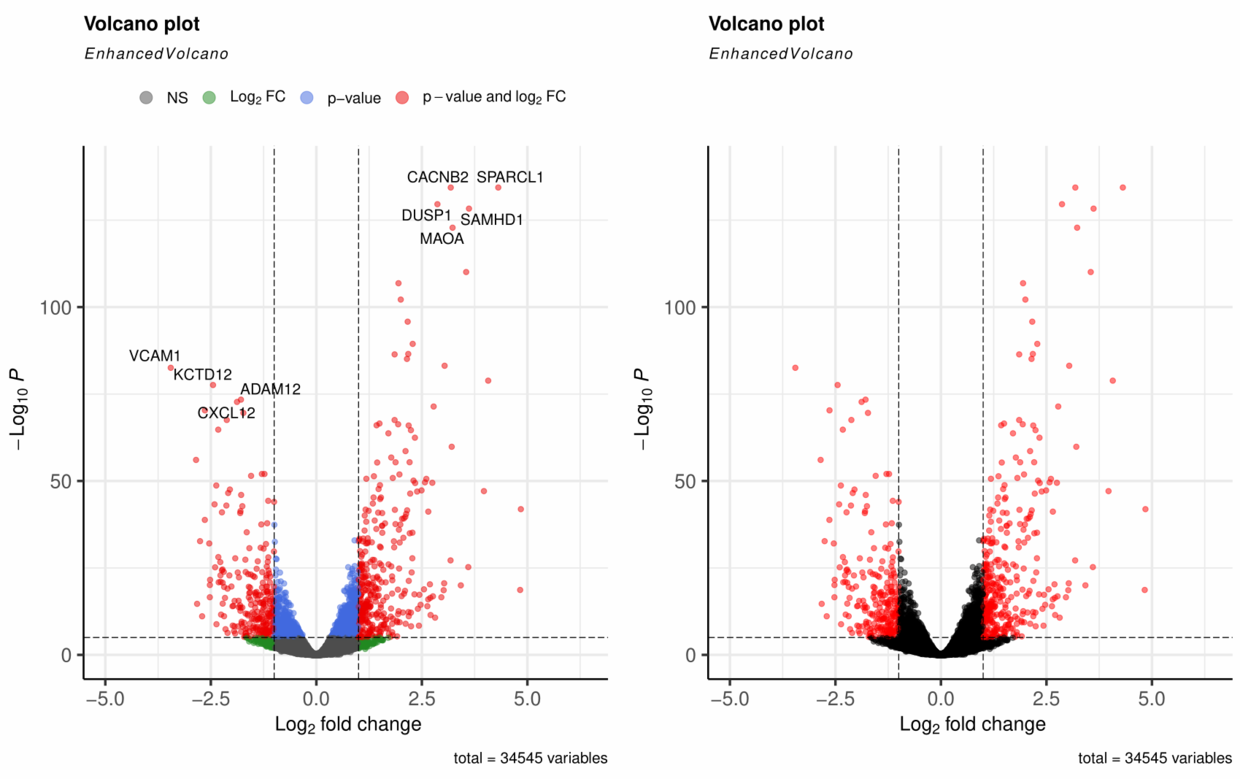
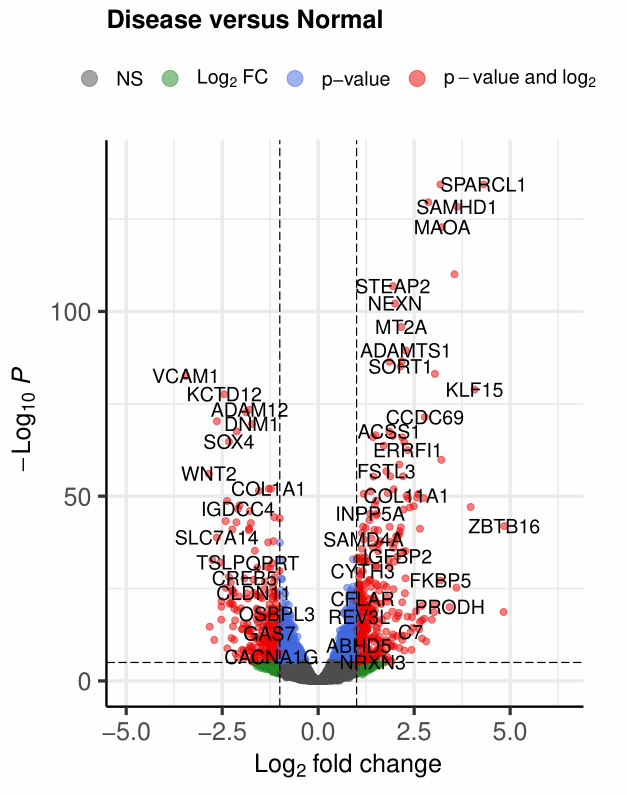
1、标题修改
title =主标题subtitle =副标题,默认为 “EnhancedVolcano”caption =图注,默认为基因总数统计
|
|
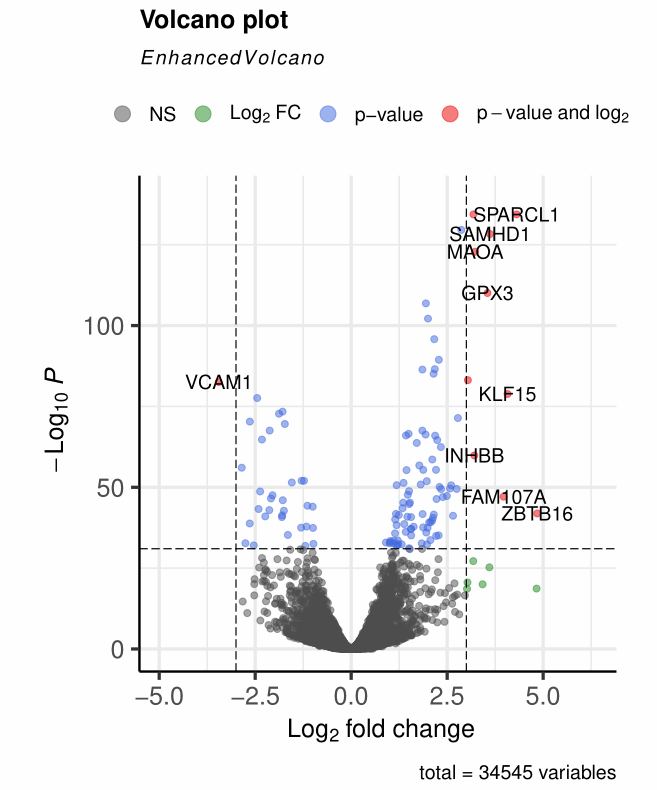
2、阈值修改
- 差异倍数:
pCutoff = 10e-32 - p值:
FCcutoff = 2
|
|
3、点point的修改
- 点的大小:
pointSize = 2 - 点的不透明度(0~1):
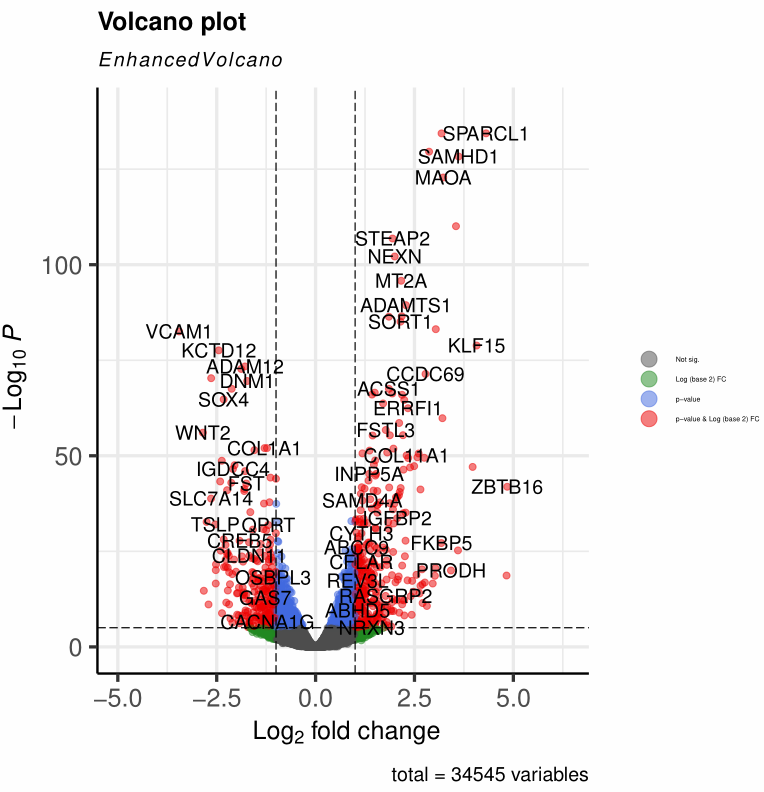
colAlpha = 1/2 - 点的颜色
col = c("grey30", "forestgreen", "royalblue", "red2"),分别对应NS,仅差异倍数,仅P值,差异倍数与P值
|
|
4、legend的修改
legendLabels=修改legend的标签内容legendLabSize = 14修改legend的标签大小legendPosition = "top"修改legend的位置legendIconSize = 5修改legend的图标大小
|
|
可使用ggplot2的语法
+ theme(legend.position="none")设置取消legend
5、设置point label
- 如上面的图,
EnhancedVolcano()会显示部分具有显著意义的基因名。我们也可以自定义修改显示哪些基因的标签
|
|