生存分析(survival analysis)的主要目的是发现与患者生存事件相关的指标因素,例如年龄性别、基因表达/突变等。如下学习相关基础知识及几种常见的生存分析方法。
参考教程:http://www.sthda.com/english/wiki/survival-analysis-basics

1、基础知识#
(1)event:表示“生存”结束的事件,最常见的形式是患者死亡,或者疾病复发等。
(2)survival time:从开始记录(通常是初次诊断患病),到event事件发生的时间。
- survival time的长短直接取决于对于事件的定义方法。
- 在UCSC xena整理的TCGA数据库中收集了4种事件定义方法,如下表所示。
|
开始日期 |
结束日期(事件发生) |
特征 |
| OS (overall survial) |
初次诊断 |
患者死亡(任何原因) |
longest |
| DSS (disease-specific survival) |
初次诊断 |
因该病导致死亡 |
/ |
| PFI (progression-free interval) |
初次诊断 |
经治疗后,该疾病首次恶化或导致患者死亡 |
shortest |
| DFI (disease-free interval) |
初次诊断 |
经治疗未发现肿瘤后,又复发或导致患者死亡 |
/ |
[1] PFI里的恶化可包括疾病严重/局部区域复发/远处转移/新生肿瘤等指标。PFS(progression-free survival)指标与PFI基本类似,区别在于不关注死亡原因。
[2] DFI里的复发可包括原位复发、远处转移、新生肿瘤(同器官)。DFS(disease-free survival)指标与DFI基本类似,区别在于同样不关注死亡原因。
参考来源:
https://www.ncbi.nlm.nih.gov/pmc/articles/PMC6066282/ Definitions and derivation of clinical survival outcome endpoints部分
OS/PFS/PFI/DFS/DFI/DSS各种生存指标定义 – 王进的个人网站 (jingege.wang)
(3)Censor 删失值
在随访的过程中,可能无法全部病人都可以收集到准确地生存时间。
- 一方面由于随访项目时间限制,直至随访结束,病人仍在世;
- 一方面可能在随访期间,病人失联、或者因其它原因去世等,无法继续随访。
这样的数据就称之为Censor,而此时的生存时间即为所能记录到的最长生存时间。病人的status要么是事件发生了,要么就是Censor。

2、分析包与示例数据#
(1)分析R包
1
2
3
|
# install.packages(c("survival", "survminer"))
library("survival") #生存分析
library("survminer") #结果可视化
|
(2)示例数据 lung {survival}
- 228个被诊断患有肺癌的病人开始长期的随访
- 如果病人死亡;则随访结束,并记录生存时间(从确诊到死亡的时间)
 1
 2
 3
 4
 5
 6
 7
 8
 9
10
11
12
13
14
15
16
17
18
19
|
head(lung)
#     inst time status age sex ph.ecog ph.karno pat.karno meal.cal wt.loss
# 1    3  306      2  74   1       1       90       100     1175      NA
# 2    3  455      2  68   1       0       90        90     1225      15
# 3    3 1010      1  56   1       0       90        90       NA      15
# 4    5  210      2  57   1       1       90        60     1150      11
# 5    1  883      2  60   1       0      100        90       NA       0
# 6   12 1022      1  74   1       1       50        80      513       0

# inst: Institution code
# time: Survival time in days(*) 生存时间
# status: censoring status 1=censored, 2=dead(*) 事件是否发生
# age: Age in years
# sex: Male=1 Female=2
# ph.ecog: ECOG performance score (0=good 5=dead)
# ph.karno: Karnofsky performance score (bad=0-good=100) rated by physician
# pat.karno: Karnofsky performance score as rated by patient
# meal.cal: Calories consumed at meals
# wt.loss: Weight loss in last six months
|
如果挖掘TCGA的数据,通常1表示事件发生,0表示censored
3、Log-rank test分析#
(1)对于一种表型因素将患者分成两组,分析是否具有显著生存差异;
- 性别、基因突变、疾病阶段等可根据表型特性分组;
- 年龄、基因表达等可设置特定阈值进行分组。
(2)survfit()分析,后续可对其结果进行绘图:
n表示每组的病人数;events表示每组有多少病人死亡;median 表示中位生存率所对应的生存时间;- 最后两列表示第三列的95%置信区间。
 1
 2
 3
 4
 5
 6
 7
 8
 9
10
11
|
fit <- survfit(Surv(time, status) ~ sex, data = lung)
print(fit)
# Call: survfit(formula = Surv(time, status) ~ sex, data = lung)
#
# 		  n events median 0.95LCL 0.95UCL
# sex=1 138    112    270     212     310
# sex=2  90     53    426     348     550

res.sum <- surv_summary(fit)
head(res.sum[res.sum$sex==1,])
head(res.sum[res.sum$sex==2,])
|
(3)survdiff() 分析显著性P值
 1
 2
 3
 4
 5
 6
 7
 8
 9
10
11
12
13
14
|
surv_diff <- survdiff(Surv(time, status) ~ sex, data = lung)
# Call:
#   survdiff(formula = Surv(time, status) ~ sex, data = lung)
#
# N Observed Expected (O-E)^2/E (O-E)^2/V
# sex=1 138      112     91.6      4.55      10.3
# sex=2  90       53     73.4      5.68      10.3
#
# Chisq= 10.3  on 1 degrees of freedom, p= 0.001

#虽然如上结果是有P值的,但是尝试之后发现从对象中只能提取chisq的值,然后再进一步转换
p.val = 1 - pchisq(surv_diff$chisq, length(surv_diff$n) - 1)
p.val
# [1] 0.001311165
|
(4)最优分组阈值 ☆
- 对于连续型变量(例如基因表达),需要手动设置一个阈值对样本进行二分组(或多分组),再进行生存分析。最常见的选择是中位数。
 1
 2
 3
 4
 5
 6
 7
 8
 9
10
11
12
13
14
15
|
### 以其中的年龄为例
median_cut = median(lung$age)
# 57
lung$age_group = ifelse(lung$age > median_cut,
                        "Old", "Young")

table(lung$age_group)
# Old Young
# 111   117


surv_diff <- survdiff(Surv(time, status) ~ age_group, data = lung)
p.val = 1 - pchisq(surv_diff$chisq, length(surv_diff$n) - 1)
p.val
# [1] 0.1702206
|
 1
 2
 3
 4
 5
 6
 7
 8
 9
10
11
12
13
14
15
16
17
18
19
20
21
|
# 使用survminer包的surv_cutpoint函数
res.cut <- surv_cutpoint(lung, time = "time", event = "status",
                         variables = c("age"))
summary(res.cut)
#     cutpoint statistic
# age       70  2.013619

# best cut
best_cut = summary(res.cut)["age","cutpoint"]
# [1] 70
lung$age_group_best = ifelse(lung$age > best_cut,
                        "Old", "Young")
table(lung$age_group_best)
# Old Young
# 46   182

surv_diff <- survdiff(Surv(time, status) ~ age_group_best, data = lung)
p.val = 1 - pchisq(surv_diff$chisq, length(surv_diff$n) - 1)
p.val
# [1] 0.0312283
# 这里的p值结果相较上述的中位数分析更为显著
|
4、Log-rank test可视化#
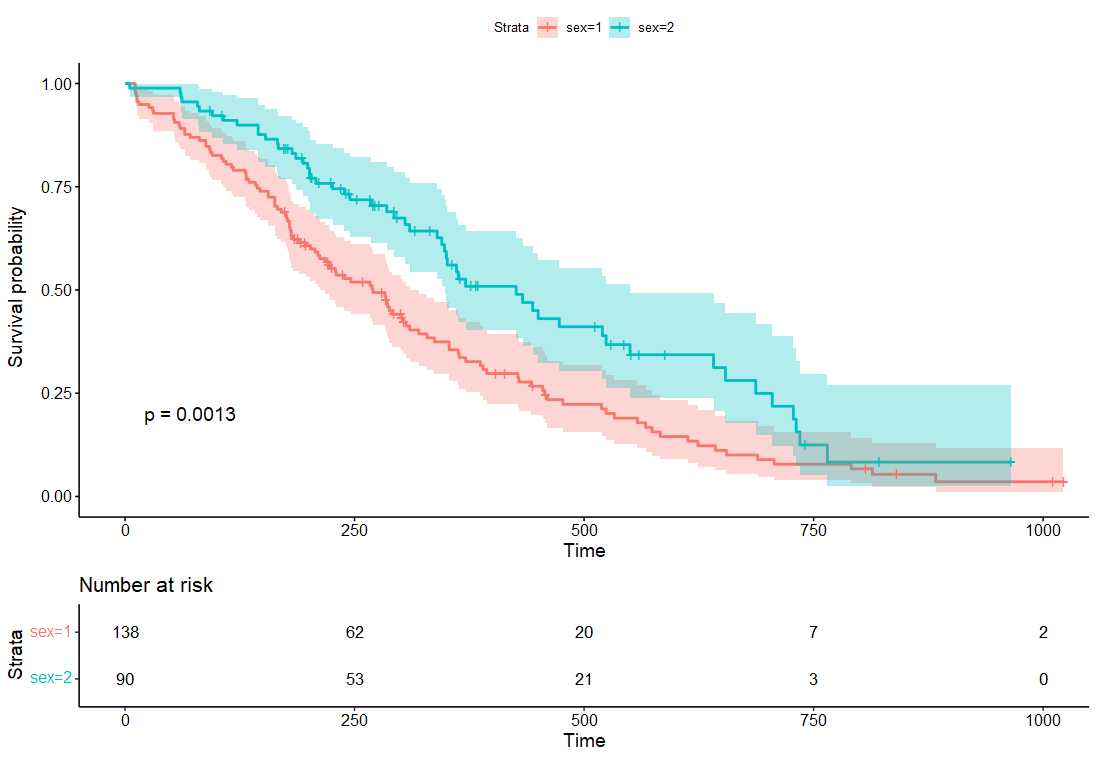
(1)绘制生存曲线,如下图所示默认绘制两个部分
- 上图:时间对应的生存率的生存曲线图,曲线中的短竖线表示在时间点有缺失值病人。不同颜色表示不同分组,阴影部分表示95%置信区间;左下角p值表示基于log-rank test计算得到的P值。
- 下表:不同时间点对应每组尚未发生事件(死亡)的数目。
1
2
3
|
ggsurvplot(fit,
           pval = TRUE, conf.int = TRUE,
           risk.table = TRUE)
|
(2)可调整的图形参数(结合具体代码理解)
 1
 2
 3
 4
 5
 6
 7
 8
 9
10
11
12
13
14
15
16
17
18
19
20
21
22
23
24
25
26
27
28
29
30
31
|
p1 = ggsurvplot(
  fit,
  pval = TRUE, conf.int = TRUE,
  risk.table = TRUE, # Add risk table
  risk.table.col = "strata", # Change risk table color by groups
  linetype = "strata", # Change line type by groups
  surv.median.line = "hv", # Specify median survival
  ggtheme = theme_bw(), # Change ggplot2 theme
  palette = c("#E7B800", "#2E9FDF")
)

p2 = ggsurvplot(
  fit,                     # survfit object with calculated statistics.
  pval = TRUE,             # show p-value of log-rank test.
  conf.int = TRUE,         # show confidence intervals for
  # point estimaes of survival curves.
  conf.int.style = "step",  # customize style of confidence intervals
  xlab = "Time in days",   # customize X axis label.
  break.time.by = 200,     # break X axis in time intervals by 200.
  ggtheme = theme_light(), # customize plot and risk table with a theme.
  risk.table = "abs_pct",  # absolute number and percentage at risk.
  risk.table.y.text.col = T,# colour risk table text annotations.
  risk.table.y.text = FALSE,# show bars instead of names in text annotations
  # in legend of risk table.
  ncensor.plot = TRUE,      # plot the number of censored subjects at time t
  surv.median.line = "hv",  # add the median survival pointer.
  legend.labs = c("Male", "Female"),    # change legend labels.
  palette =  c("#E7B800", "#2E9FDF") # custom color palettes.
)

arrange_ggsurvplots(list(p1,p2))
|
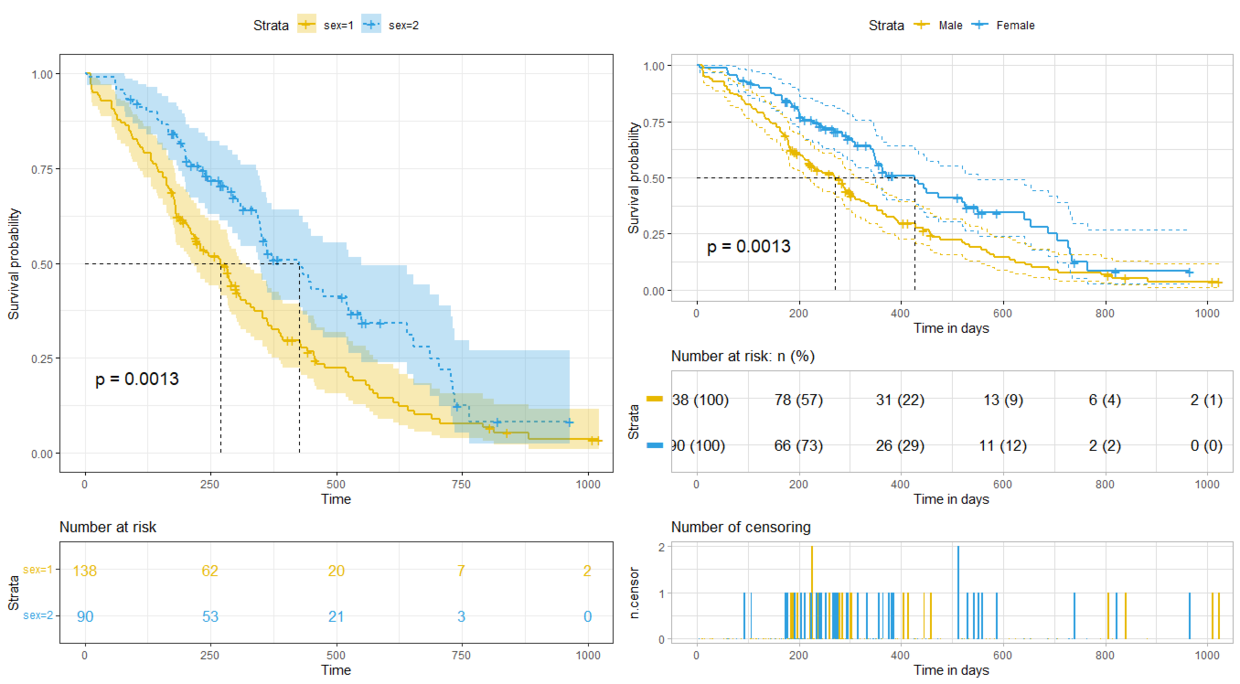
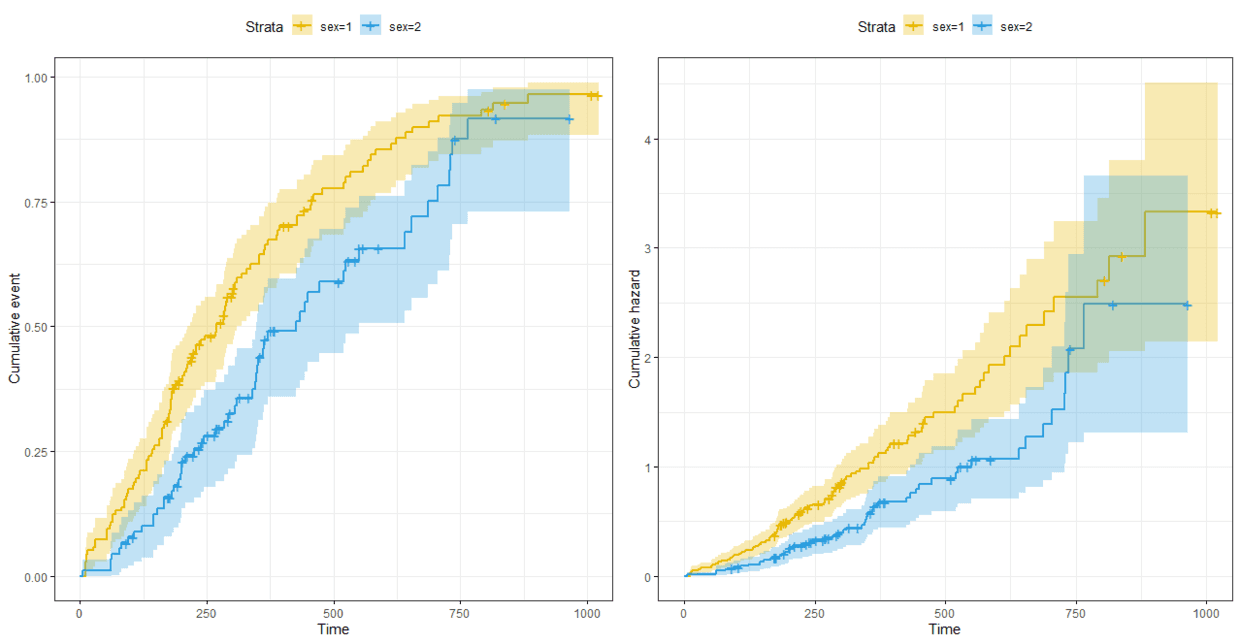
(3)如上是经典的生存曲线,同时也支持绘制其它类型曲线
 1
 2
 3
 4
 5
 6
 7
 8
 9
10
11
12
13
14
15
16
17
18
19
20
|
# 参数`fun="event"`,表示cumulative event事件累计发生率
p3=ggsurvplot(
  fit,
  conf.int = TRUE,
  risk.table.col = "strata", # Change risk table color by groups
  ggtheme = theme_bw(), # Change ggplot2 theme
  palette = c("#E7B800", "#2E9FDF"),
  fun = "event"
)
# 参数`fun="cumhaz"`,表示cummulative hazard表示累计风险水平(在时刻t,事件发生的可能性)
p4=ggsurvplot(
  fit,
  conf.int = TRUE,
  risk.table.col = "strata", # Change risk table color by groups
  ggtheme = theme_bw(), # Change ggplot2 theme
  palette = c("#E7B800", "#2E9FDF"),
  fun = "cumhaz"
)

arrange_ggsurvplots(list(p3,p4))
|
5、比例风险模型分析#
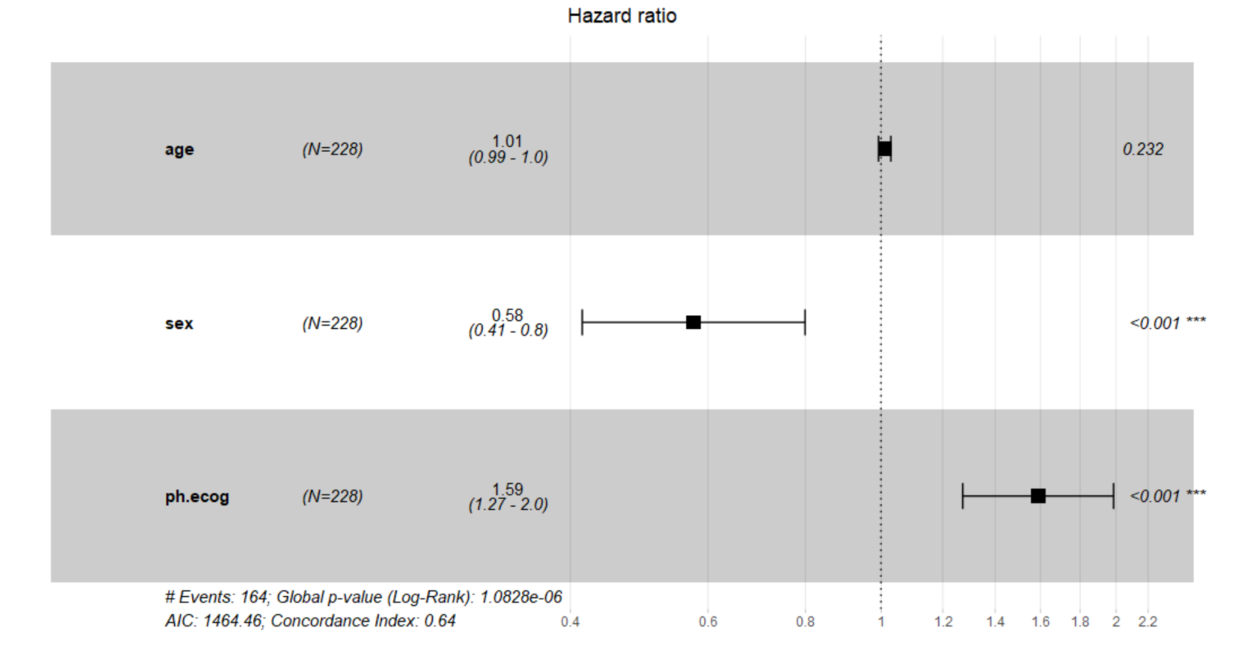
比例风险模型又称Cox Proportional-Hazards Model,用于量化每个表型对于事件发生的影响大小。
- 表型可以是分类变量或者是连续变量;
- 衡量影响大小的指标称为Hazard rate(风险因子),简称HR
- Hazard ratio(HR)=exp(coef)
- HR<1(coef<0) 表明负相关—该变量值越大,事件发生风险越低,生存率越高;
- HR>1(coef>0) 表明正相关—该变量值越大,事件发生风险越高,生存率越小。
(1) 单变量Cox回归
 1
 2
 3
 4
 5
 6
 7
 8
 9
10
11
12
13
|
res.cox <- coxph(Surv(time, status) ~ sex, data = lung)
res.cox
# Call:
#   coxph(formula = Surv(time, status) ~ sex, data = lung)
#
# coef exp(coef) se(coef)      z       p
# sex -0.5310    0.5880   0.1672 -3.176 0.00149
#
# Likelihood ratio test=10.63  on 1 df, p=0.001111
# n= 228, number of events= 165
exp(res.cox$coefficients)
# sex
# 0.5880028
|
(2)对多个变量分别进行单变量Cox回归
 1
 2
 3
 4
 5
 6
 7
 8
 9
10
11
12
13
14
15
16
17
18
19
20
21
22
23
24
25
26
27
28
29
30
31
32
|
#分别回归
covariates <- c("age", "sex", "ph.karno", "ph.ecog", "wt.loss")
univ_formulas <- sapply(covariates,
function(x) as.formula(paste('Surv(time, status)~', x)))
univ_models <- lapply( univ_formulas, function(x){coxph(x, data = lung)})

#提取各个变量的回归结果
univ_results <- lapply(univ_models,
                       function(x){
                         x <- summary(x)
                         p.value<-signif(x$wald["pvalue"], digits=2)
                         wald.test<-signif(x$wald["test"], digits=2)
                         beta<-signif(x$coef[1], digits=2);#coeficient beta
                         HR <-signif(x$coef[2], digits=2);#exp(beta)
                         HR.confint.lower <- signif(x$conf.int[,"lower .95"], 2)
                         HR.confint.upper <- signif(x$conf.int[,"upper .95"],2)
                         HR <- paste0(HR, " (",
                                      HR.confint.lower, "-", HR.confint.upper, ")")
                         res<-c(beta, HR, wald.test, p.value)
                         names(res)<-c("beta", "HR (95% CI for HR)", "wald.test",
                                       "p.value")
                         return(res)
                         #return(exp(cbind(coef(x),confint(x))))
                       })
res <- t(as.data.frame(univ_results, check.names = FALSE))
as.data.frame(res)
#            beta HR (95% CI for HR) wald.test p.value
# age       0.019            1 (1-1)       4.1   0.042
# sex       -0.53   0.59 (0.42-0.82)        10  0.0015
# ph.karno -0.016      0.98 (0.97-1)       7.9   0.005
# ph.ecog    0.48        1.6 (1.3-2)        18 2.7e-05
# wt.loss  0.0013         1 (0.99-1)      0.05    0.83
|
(3)多变量Cox回归(多元回归)
 1
 2
 3
 4
 5
 6
 7
 8
 9
10
11
12
13
14
15
16
17
18
19
20
21
22
23
24
25
26
27
28
29
|
res.cox <- coxph(Surv(time, status) ~ age + sex + ph.ecog, data = lung)
summary(res.cox)
# Call:
#   coxph(formula = Surv(time, status) ~ age + sex + ph.ecog, data = lung)
#
# n= 227, number of events= 164
# (因为不存在,1个观察量被删除了)
#
# 			    coef exp(coef)  se(coef)      z Pr(>|z|)
# age      0.011067  1.011128  0.009267  1.194 0.232416
# sex     -0.552612  0.575445  0.167739 -3.294 0.000986 ***
# ph.ecog  0.463728  1.589991  0.113577  4.083 4.45e-05 ***
#   ---
#   Signif. codes:  0 ‘***’ 0.001 ‘**’ 0.01 ‘*’ 0.05 ‘.’ 0.1 ‘ ’ 1
#
# 		  exp(coef) exp(-coef) lower .95 upper .95
# age        1.0111     0.9890    0.9929    1.0297
# sex        0.5754     1.7378    0.4142    0.7994
# ph.ecog    1.5900     0.6289    1.2727    1.9864
#
# Concordance= 0.637  (se = 0.025 )
# Likelihood ratio test= 30.5  on 3 df,   p=1e-06
# Wald test            = 29.93  on 3 df,   p=1e-06
# Score (logrank) test = 30.5  on 3 df,   p=1e-06

ggforest(res.cox, data = lung,
         main = "Hazard ratio",
         cpositions = c(0.10, 0.22, 0.4),
         fontsize = 1.0)
|
6、cox模式lasso回归#
1
2
|
install.packages("glmnet")
library(glmnet)
|
(1)示例数据
 1
 2
 3
 4
 5
 6
 7
 8
 9
10
11
12
13
14
15
16
17
18
19
20
21
22
23
|
library(survival)
data(CoxExample)
x <- CoxExample$x
y <- CoxExample$y

## 标签数据(生存资料)
dim(y)
# [1] 1000    2
head(y)
#            time status
# [1,] 1.76877757      1
# [2,] 0.54528404      1
# [3,] 0.04485918      0

## 特征数据(类似基因表达数据)
dim(x)
# [1] 1000   30
x[1:4,1:4]
#            [,1]       [,2]       [,3]       [,4]
# [1,] -0.8767670 -0.6135224 -0.5675738  0.6621599
# [2,] -0.7463894 -1.7519457  0.2854590  1.1392105
# [3,]  1.3759148 -0.2641132  0.8872741  0.3841870
# [4,]  0.2375820  0.7859162 -0.8967028 -0.8339338
|
(2)lasso分析
1
2
3
4
5
6
|
fit <- glmnet(x, y, family = "cox")
print(fit)

plot(fit, xvar = "norm", label = FALSE) # default
# plot(fit, xvar = "lambda", label = FALSE)
# plot(fit, xvar = "dev", label = FALSE)
|
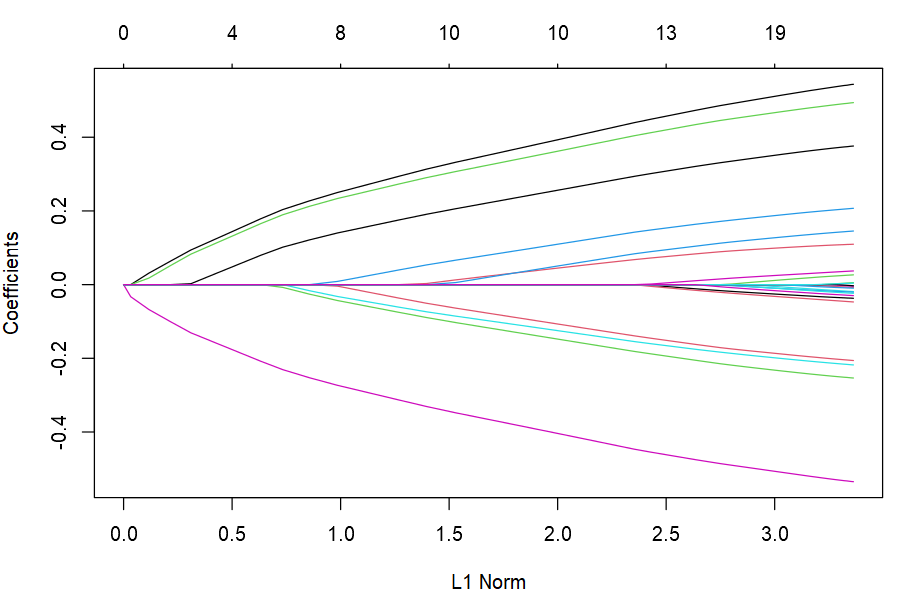
如下图所示:
- 下轴:不同的L1 norm惩罚值;
- 上轴:在相应L1 norm惩罚值里,当前系数非0的变量个数;
- 左轴:变量的系数值
(3)交叉验证
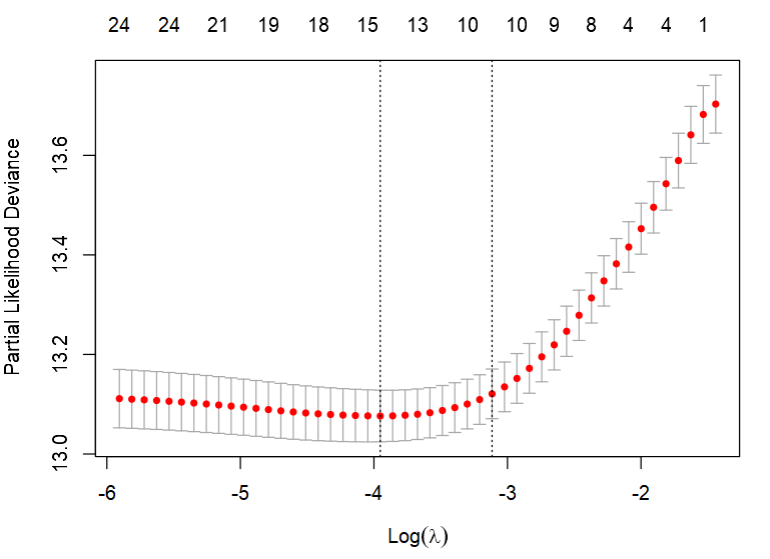
在cox模式的lasso回归交叉验证中,支持两类评价指标
deviance:为默认指标;该值越小,模型预测效果越好C:即C-index,类似AUC;该值越大,模型预测效果越好
1
2
3
4
|
set.seed(1)
cvfit <- cv.glmnet(x, y, family = "cox", type.measure = "deviance")
# cvfit <- cv.glmnet(x, y, family = "cox", type.measure = "C")
plot(cvfit)
|
如下图,两条虚线分别表示两个λ值
- 左边的虚线→
lambda.min :表示评价指标最优的λ取值;
- 右边的虚线→
lambda.1se:表示lambda.min的一倍标准差下对模型更为严格惩罚的λ取值。
 1
 2
 3
 4
 5
 6
 7
 8
 9
10
11
12
13
14
15
16
17
18
19
20
21
22
23
24
25
26
27
28
|
cvfit$lambda.min
# [1] 0.01920429
cvfit$lambda.1se
# 1] 0.04436439

coef(cvfit, s = cvfit$lambda.min)

library(tidyverse)
coef(cvfit, s="lambda.min") %>%
  as.matrix() %>% as.data.frame() %>%
  tibble::rownames_to_column(var = "mRNA") %>%
  dplyr::rename(coef=`1`) %>%
  dplyr::filter(coef!=0)
#    mRNA        coef
# 1    V1  0.47972069
# 2    V2 -0.16674492
# 3    V3 -0.21014303
# 4    V4  0.16781912
# 5    V5 -0.17951289
# 6    V6 -0.48058218
# 7    V7  0.32603876
# 8    V8  0.08646499
# 9    V9  0.44014703
# 10  V10  0.10854409
# 11  V13  0.01304299
# 12  V17 -0.01388096
# 13  V25 -0.01830447
# 14  V30 -0.00301953
|


