R包DoubletFinder可用于检测基于Droplet单细胞测序技术(10X)的双细胞。如下简单学习识别原理以用法。
- 原始论文:https://doi.org/10.1016/j.cels.2019.03.003
- 官方手册:https://github.com/chris-mcginnis-ucsf/DoubletFinder
- 视频教程:https://www.youtube.com/watch?v=NqvAS4HgmrE
1
2
|
remotes::install_github('chris-mcginnis-ucsf/DoubletFinder')
library(DoubletFinder)
|
Bug in Seurat v4: could not find function “paramSweep_v3”
https://github.com/chris-mcginnis-ucsf/DoubletFinder/issues/184
1
|
remotes::install_github('https://github.com/ekernf01/DoubletFinder', force = T)
|
1、原理简介#
(1)根据随机两个单细胞的平均表达水平模拟出若干artificial doublet;
(2)从模拟双细胞的角度,计算出这些模拟双细胞的最近邻细胞群;
(3)从真实单细胞数据角度,计算每个细胞与模拟双细胞群的距离"pANN";
(4)最后通过期望的双细胞比例,设置"pANN"阈值,划分出双细胞群。

(1)pN:模拟出的artificial doublet数量。不同取值对识别结果影响不大,默认为0.25。
(2)pK:计算每个双细胞的最近邻居细胞数量,不同取值对识别结果影响很大,需结合数据选最佳值。
(3)nExp:期望的双细胞群比例。如下图所示(10X v3.1),不同测序数据体量的预期占比不同。
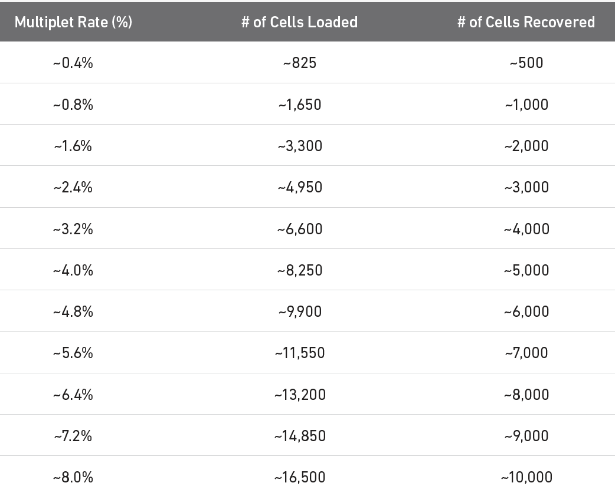
例如对于10000个细胞的单细胞表达矩阵, 当pN=0.25、pK=0.1、nExp=0.08,表示如下含义:
(1)随机模拟出3333个双细胞(总共13333);(2)计算每个模拟双细胞的1333个最近邻细胞;
(3)最终期望识别出800个双细胞。
-
双细胞群根据组成细胞的转录相似性可分为如下两大类
(1)heterotypic doublets :doublets formed from transcriptionally-distinct cell states – but is insensitive to homotypic doublets
(2)homotypic doublets :doublets formed from transcriptionally-similar cell states
作者认为上述识别算法适合于检测heterotypic doublets,因此在计算过程中有必要考虑homotypic doublets所占比例的影响。
2、计算过程#
 1
 2
 3
 4
 5
 6
 7
 8
 9
10
11
12
13
14
15
16
17
18
19
20
21
22
23
24
25
26
27
28
29
30
31
|
# https://support.10xgenomics.com/single-cell-gene-expression/datasets/2.1.0/pbmc8k
untar("pbmc8k_filtered_gene_bc_matrices.tar.gz")
counts = Read10X("filtered_gene_bc_matrices/GRCh38/")
sce = CreateSeuratObject(counts)
dim(sce)
# [1] 33694  8381

## (1) 预处理:质控过滤 + 降维分群
library(Seurat)
library(tidyverse)

sce = PercentageFeatureSet(sce, "^MT-", col.name = "percent_mito")
sce = sce %>%
  subset(., nFeature_RNA > 500) %>%
  subset(., nCount_RNA > 800) %>%
  subset(., percent_mito < 10)
sce = sce %>%
  NormalizeData() %>%
  FindVariableFeatures() %>%
  ScaleData()
sce = sce %>%
  RunPCA() %>%
  RunUMAP(dims = 1:30) %>%  #RunTSNE
  FindNeighbors(dims = 1:30) %>%
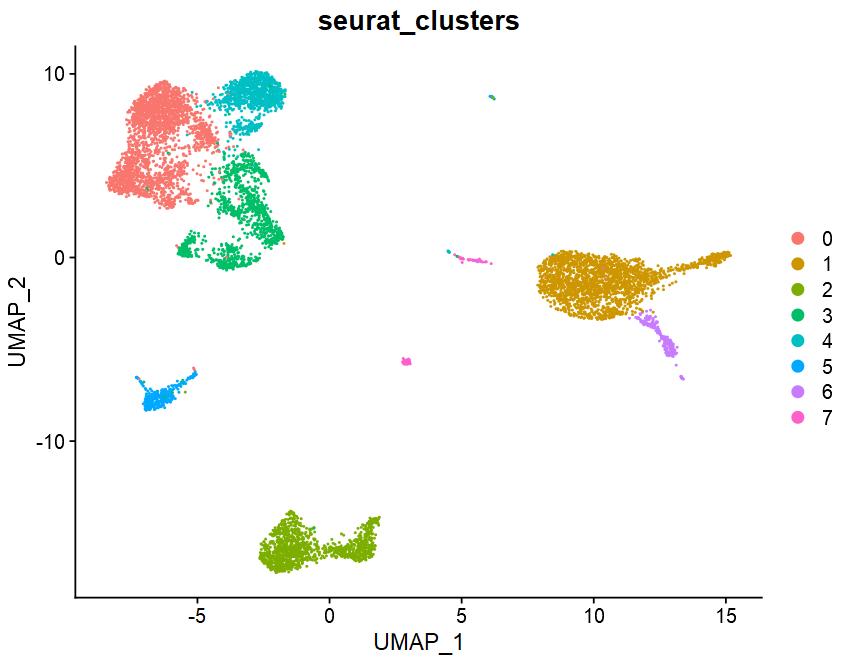
  FindClusters(resolution = 0.1)

table(sce$seurat_clusters)
#    0    1    2    3    4    5    6    7
# 2330 2039 1230 1142  970  339  213  108

DimPlot(sce, reduction = "umap", group.by = "orig.ident")
|
 1
 2
 3
 4
 5
 6
 7
 8
 9
10
11
12
13
14
15
|
## (2) DoubletFinder分析
library(DoubletFinder)

# 首先获得最佳的pK值
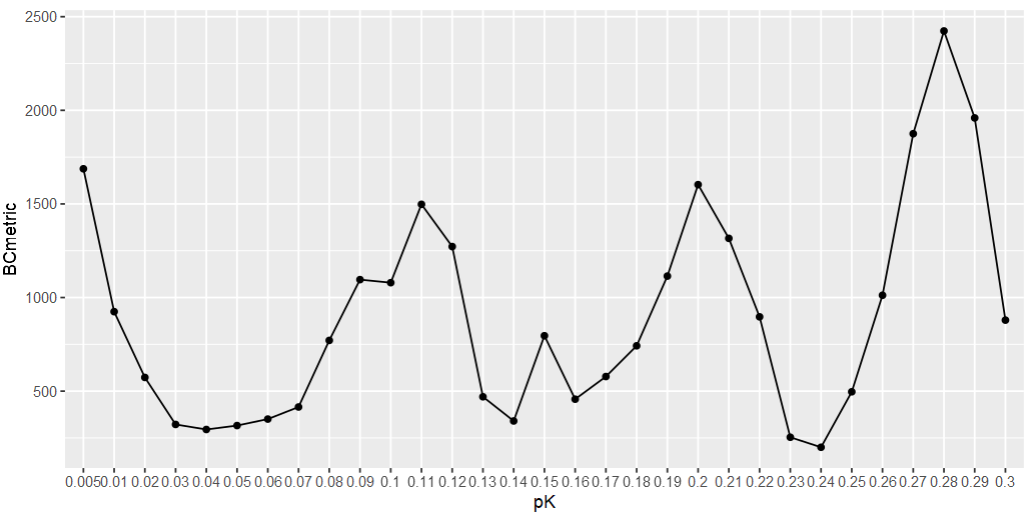
sweep.res.list <- paramSweep_v3(sce, PCs = 1:30, sct = FALSE)
sweep.stats <- summarizeSweep(sweep.res.list, GT = FALSE)
bcmvn <- find.pK(sweep.stats)
pk_best = bcmvn %>%
  dplyr::arrange(desc(BCmetric)) %>%
  dplyr::pull(pK) %>%
  .[1] %>% as.character() %>% as.numeric()
# [1] 0.28
ggplot(bcmvn, aes(x=pK, y=BCmetric, group=1)) +
  geom_point() +
  geom_line()
|
 1
 2
 3
 4
 5
 6
 7
 8
 9
10
11
12
13
14
15
16
17
18
19
20
21
22
23
24
25
26
27
28
29
|
# 然后估算出双细胞群中,homotypic doublets的比例(optional)
annotations <- sce$seurat_clusters
homotypic.prop <- modelHomotypic(annotations)
# [1] 0.1928876

# 根据10X V3.1,对于8K+的单细胞数据,期望的双细胞占比为7%左右
nExp_poi <- round(0.07*nrow(sce@meta.data))        #586
nExp_poi.adj <- round(nExp_poi*(1-homotypic.prop)) #473

# 最后根据上述参数(pN=0.25, pK=0.28, nExp=0.07), 识别出双细胞
sce <- doubletFinder_v3(sce, PCs = 1:30,
                        pN = 0.25, pK = pk_best, nExp = nExp_poi, # nExp = nExp_poi.adj,
                        reuse.pANN = FALSE, sct = FALSE)
head(sce@meta.data[,c("pANN_0.25_0.28_586",
                      "DF.classifications_0.25_0.28_586")])
#                    pANN_0.25_0.28_586 DF.classifications_0.25_0.28_586
# AAACCTGAGCATCATC-1            0.21824                          Singlet
# AAACCTGAGCTAACTC-1            0.35488                          Singlet
# AAACCTGAGCTAGTGG-1            0.18624                          Singlet
# AAACCTGCACATTAGC-1            0.10816                          Singlet
# AAACCTGCACTGTTAG-1            0.34528                          Singlet
# AAACCTGCATAGTAAG-1            0.35904                          Singlet

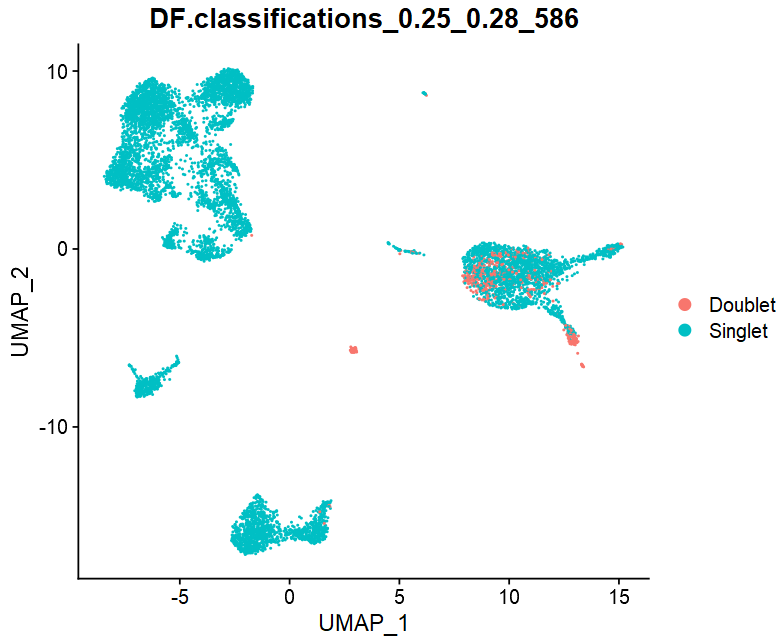
DimPlot(sce, reduction = "umap",
        group.by = "DF.classifications_0.25_0.28_586")

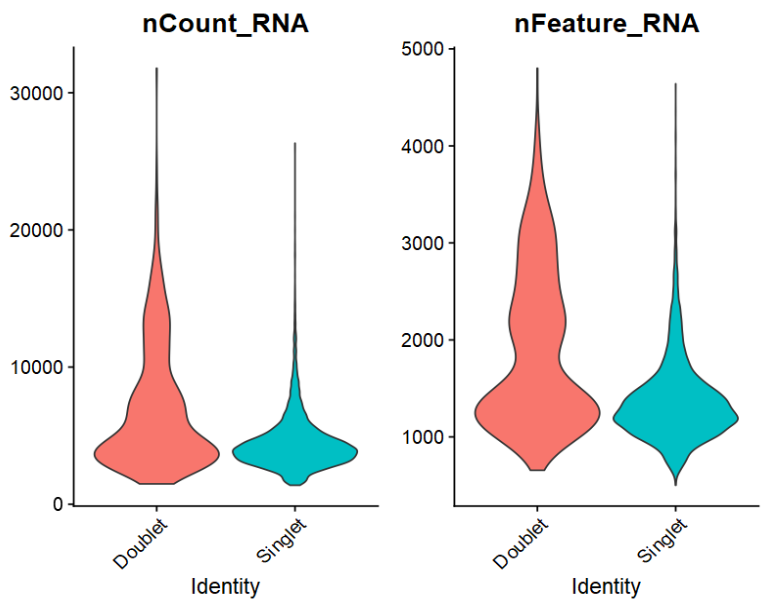
VlnPlot(sce, group.by = "DF.classifications_0.25_0.28_586",
        features = c("nCount_RNA", "nFeature_RNA"),
        pt.size = 0, ncol = 2)
|
