主要参考资料:
1、https://htmlpreview.github.io/?https://github.com/sqjin/CellChat/blob/master/tutorial/CellChat-vignette.html
2、https://htmlpreview.github.io/?https://github.com/sqjin/CellChat/blob/master/tutorial/Comparison_analysis_of_multiple_datasets.html
3、细胞通讯讲座cellchat 生信技能树 jimmy 哔哩哔哩直播 录屏版 https://www.youtube.com/watch?v=kc45au1RhNs
1、细胞通讯基础知识#
1.1 细胞信号传导类型#
(1)旁分泌:如下图A,细胞通过释放配体与相邻细胞的受体结合进行交流。
(2)突触信号:如下图B,神经细胞传递旁分泌信号的方式,配体为神经递质。
(3)内分泌信号:如下图C,经循环系统(血液),将这些信号(激素)带到身体远端的目标细胞。
(4)自分泌信号:如下图D,细胞向自身发出信号,释放与自身表面受体结合的配体。
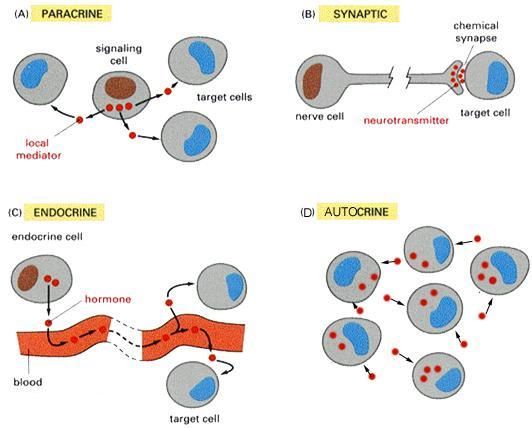
(5)通过细胞与细胞的接触发出信号,即细胞的膜表面配体与另一细胞的膜表面受体直接结合。
1.2 配受体结合的影响因素#
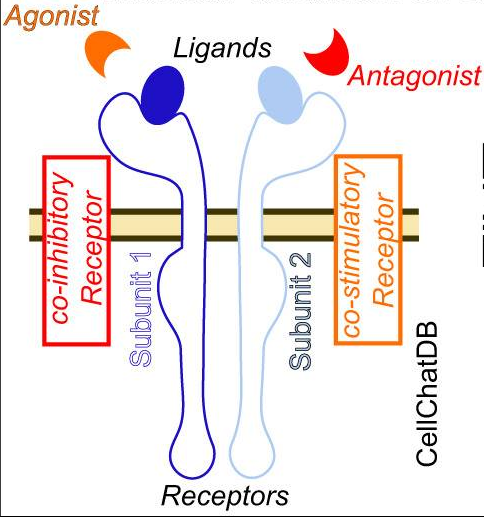
如下图所示为TGFβ信号通路的传递过程,其中涉及的配受体以及影响因素情况如下
(1)Ligand配体:TGFβ
(2)Receptor受体:TGFβ R1,TGFβ R2(多亚基单位subunit)
(3)Agonist激动剂:THBS1(可能来自配体细胞或者受体细胞)
(4)Antagonist激动剂:Decrin,FMOD(同上)
(5)Membrane-bound inhibitory coreceptor膜表面共抑制受体:BAMB1
(6)Membrane-bound stimulatory coreceptorr膜表面共刺激受体:

1.3 配受体结合/通讯概率#
针对上述配体结合的多种影响因素,CellChat提供了如下计算两个细胞群(i与j)的第k对配受体结合/通讯概率的方法。
(1)L代表细胞群的配体基因的平均表达水平,如果有多亚基组成,则计算几何平均数;同理,R代表受体基因
(2)RA表示膜表面共刺激受体表达情况;RI表示膜表面共抑制受体表达情况
(3)AG表示激动剂的表达情况,AN表示拮抗剂的表达情况
(4)Kh为常数0.5

1.4 CellChat的配受体数据库#
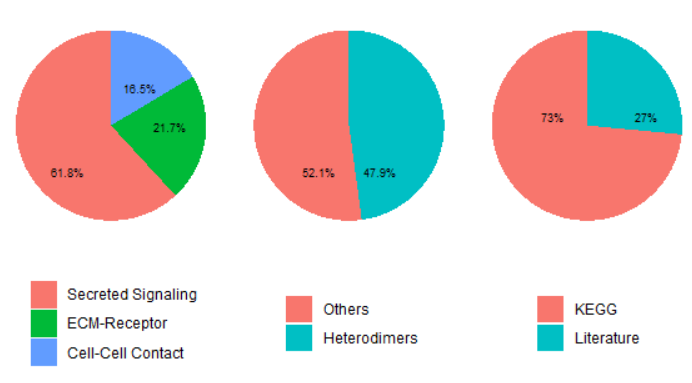
- 分为人和老鼠两种,收集自KEGG与文献
- 根据信号传递方式分为三种(1)Secreted Signaling(2)ECM-Receptor(3)Cell-Cell Contact
- 其中有很多配受体是复合亚基构成的
 1
 2
 3
 4
 5
 6
 7
 8
 9
10
11
12
13
14
15
16
17
18
19
20
|
library(CellChat)
CellChatDB <- CellChatDB.human # use CellChatDB.mouse if running on mouse data
names(CellChatDB)
# [1] "interaction" "complex"     "cofactor"    "geneInfo"
head(CellChatDB$interaction,1) %>% t()
#                    TGFB1_TGFBR1_TGFBR2
# interaction_name   "TGFB1_TGFBR1_TGFBR2"
# pathway_name       "TGFb"
# ligand             "TGFB1"
# receptor           "TGFbR1_R2"
# agonist            "TGFb agonist"
# antagonist         "TGFb antagonist"
# co_A_receptor      ""
# co_I_receptor      "TGFb inhibition receptor"
# evidence           "KEGG: hsa04350"
# annotation         "Secreted Signaling"
# interaction_name_2 "TGFB1 - (TGFBR1+TGFBR2)"
table(CellChatDB$interaction$annotation)
# Cell-Cell Contact       ECM-Receptor Secreted Signaling
#               319                421               1199
|
2、单细胞数据集细胞通讯分析#
2.1 构建CellChat对象#
- 需要提供(1)标准化的单细胞表达矩阵[对应Seurat的data slot](2)细胞类型注释信息
- 如下是官方文档给出的皮肤组织的单细胞测序数据集
 1
 2
 3
 4
 5
 6
 7
 8
 9
10
11
12
13
14
15
16
17
18
19
20
21
22
23
24
25
26
|
# load(url("https://ndownloader.figshare.com/files/25950872"))
data.input = data_humanSkin$data
meta = data_humanSkin$meta
cell.use = rownames(meta)[meta$condition == "LS"]
data.input = data.input[, cell.use]
dim(data.input)
# [1] 17328  5011
meta = meta[cell.use, ]
head(meta,2)
#                     patient.id condition      labels
# S1_AACTCCCAGAGCTGCA   Patient1        LS Inflam. FIB
# S1_CAACCAATCCTCATTA   Patient1        LS   FBN1+ FIB
library(CellChat)
cellchat <- createCellChat(object = data.input, meta = meta, group.by = "labels")
cellchat
# An object of class CellChat created from a single dataset
# 17328 genes.
# 5011 cells.
levels(cellchat@idents)

#原始表达数据在data对象里
cellchat@data[1:4,1:4]
#原始注释信息在meta对象里
cellchat@meta %>% head()
#指定的细胞群注释信息在idents里
table(cellchat@idents)
|
2.2 分析配受体通讯概率#
(1)整合配受体数据库
 1
 2
 3
 4
 5
 6
 7
 8
 9
10
11
|
CellChatDB <- CellChatDB.human
# use Secreted Signaling
CellChatDB.use <- subsetDB(CellChatDB, search = "Secreted Signaling")
cellchat@DB <- CellChatDB.use

#提取配受体相关的基因至一个单独的矩阵
dim(cellchat@data.signaling)
#[1] 0 0
cellchat <- subsetData(cellchat)
dim(cellchat@data.signaling)
#[1]  555 5011
|
(2)分析通讯概率
 1
 2
 3
 4
 5
 6
 7
 8
 9
10
11
12
13
14
15
16
17
18
19
20
21
22
23
24
25
26
27
28
29
30
31
32
33
34
35
36
37
38
39
40
41
42
43
44
45
46
47
48
49
50
51
52
53
54
55
56
57
58
59
60
|
## (1)首先鉴别每个细胞群的高表达(logFC>0)的配受体对基因(差异分析)
cellchat@var.features %>% dim() #NULL
cellchat <- identifyOverExpressedGenes(cellchat)
cellchat@var.features$features.info %>% head(2)
#         clusters features       pvalues     logFC pct.1 pct.2   pvalues.adj
# CXCL12 APOE+ FIB   CXCL12 4.948508e-271 1.6432928 0.691 0.198 2.746422e-268
# DCN    APOE+ FIB      DCN 7.587647e-186 0.7637475 0.899 0.392 4.211144e-183

table(cellchat@var.features$features.info$clusters)
# APOE+ FIB   CD40LG+ TC         cDC1         cDC2 COL11A1+ FIB
# 126           77           55          108           88
# FBN1+ FIB   Inflam. DC  Inflam. FIB   Inflam. TC           LC
# 139           80          160           81          107
# NKT           TC
# 56           69

## (2)然后将这些高表达配受体基因关联的通路整理到LR对象里
cellchat@LR #list()
cellchat <- identifyOverExpressedInteractions(cellchat)
head(cellchat@LR$LRsig, 1) %>% t()
#                    TGFB1_TGFBR1_TGFBR2
# interaction_name   "TGFB1_TGFBR1_TGFBR2"
# pathway_name       "TGFb"
# ligand             "TGFB1"
# receptor           "TGFbR1_R2"
# agonist            "TGFb agonist"
# antagonist         "TGFb antagonist"
# co_A_receptor      ""
# co_I_receptor      "TGFb inhibition receptor"
# evidence           "KEGG: hsa04350"
# annotation         "Secreted Signaling"
# interaction_name_2 "TGFB1 - (TGFBR1+TGFBR2)"

## (3) (optinal)再然后根据PPI网络对data.signaling表达矩阵进行diffusion process处理,主要是避免过度的稀疏性
### useful when analyzing single-cell data with shallow sequencing depth
### because the projection reduces the dropout effects of signaling genes,
### in particular for possible zero expression of subunits of ligands/receptors
cellchat@data.project %>% dim() # [1] 0 0
cellchat <- projectData(cellchat, PPI.human)
cellchat@data.project %>% dim() # [1]  555 5011


## (4)之后就可以计算配受体通讯概率
cellchat@net # list()
cellchat <- computeCommunProb(cellchat)
cellchat@net$prob %>% dim()
# [1]  12  12 656
##表示656个配受体对在12种细胞群之间的通讯概率,显著性
cellchat@net$prob[1:4,1:4,1]
#              APOE+ FIB FBN1+ FIB COL11A1+ FIB Inflam. FIB
# APOE+ FIB            0         0            0           0
# FBN1+ FIB            0         0            0           0
# COL11A1+ FIB         0         0            0           0
# Inflam. FIB          0         0            0           0
cellchat@net$pval[1:4,1:4,1]
#              APOE+ FIB FBN1+ FIB COL11A1+ FIB Inflam. FIB
# APOE+ FIB            1         1            1           1
# FBN1+ FIB            1         1            1           1
# COL11A1+ FIB         1         1            1           1
# Inflam. FIB          1         1            1           1
|
2.3 基于配受体通讯的衍生分析1#
 1
 2
 3
 4
 5
 6
 7
 8
 9
10
11
12
13
14
15
16
17
18
19
20
21
22
23
24
25
26
27
28
29
30
31
32
33
34
35
36
37
38
39
40
41
42
43
44
45
46
47
48
49
50
51
52
|
#(1)归纳细胞群之间的通讯
cellchat <- aggregateNet(cellchat)
##有如下两类结果 count,weight
cellchat@net$count %>% dim()
#[1] 12 12
cellchat@net$count[1:4,1:4]
#              APOE+ FIB FBN1+ FIB COL11A1+ FIB Inflam. FIB
# APOE+ FIB            1         3            1           1
# FBN1+ FIB            1         3            1           1
# COL11A1+ FIB         1         2            1           1
# Inflam. FIB          0         2            0           0

##summarizing the communication probability.
cellchat@net$weight %>% dim()
#[1] 12 12
cellchat@net$weight[1:4,1:4]
#                APOE+ FIB  FBN1+ FIB COL11A1+ FIB Inflam. FIB
# APOE+ FIB    0.006276293 0.07304813  0.007386033 0.008251458
# FBN1+ FIB    0.004854738 0.05861039  0.005714571 0.006385410
# COL11A1+ FIB 0.003575889 0.01721547  0.004210181 0.004705254
# Inflam. FIB  0.000000000 0.04183220  0.000000000 0.000000000


#(2) 将配受体水平的细胞通讯归纳为通路水平的细胞通讯
###summarizing all related ligands/receptors
cellchat@netP #list()
cellchat <- computeCommunProbPathway(cellchat)
cellchat@netP$prob %>% dim()
# [1] 12 12 13
##表示13条通路在12种细胞群之间的通讯概率
cellchat@netP$pathways
# [1] "MIF"        "GALECTIN"   "CXCL"       "COMPLEMENT" "FGF"
# [6] "TNF"        "CCL"        "GAS"        "IL4"        "CD40"
# [11] "LIGHT"      "CSF"        "VEGF"


tmp = cellchat@netP$prob
dimnames(tmp)
netP_df = lapply(dimnames(tmp)[[3]], function(x){
	# x=dimnames(a)[[3]][1]
	tmp[,,x] %>% as.data.frame() %>%
		tibble::rownames_to_column("Source") %>%
		dplyr::mutate(Pathway=x) %>%
		dplyr::select(Pathway, Source, dplyr::everything())

}) %>% do.call(rbind, .)
#查看感兴趣的细胞类型的涉及通路
celltype=c("DNT_1","DNT_2")
idx1 = netP_df$Source %in% celltype
idx2 = rowSums(netP_df[,c(-1,-2)])!=0
idx3 = rowSums(netP_df[,celltype,drop=F])!=0
netP_df[idx1 & idx2 | idx3, ]
|
2.4 分析结果可视化#
2.4.1 细胞群水平#
1
2
3
4
5
6
7
|
groupSize <- as.numeric(table(cellchat@idents))
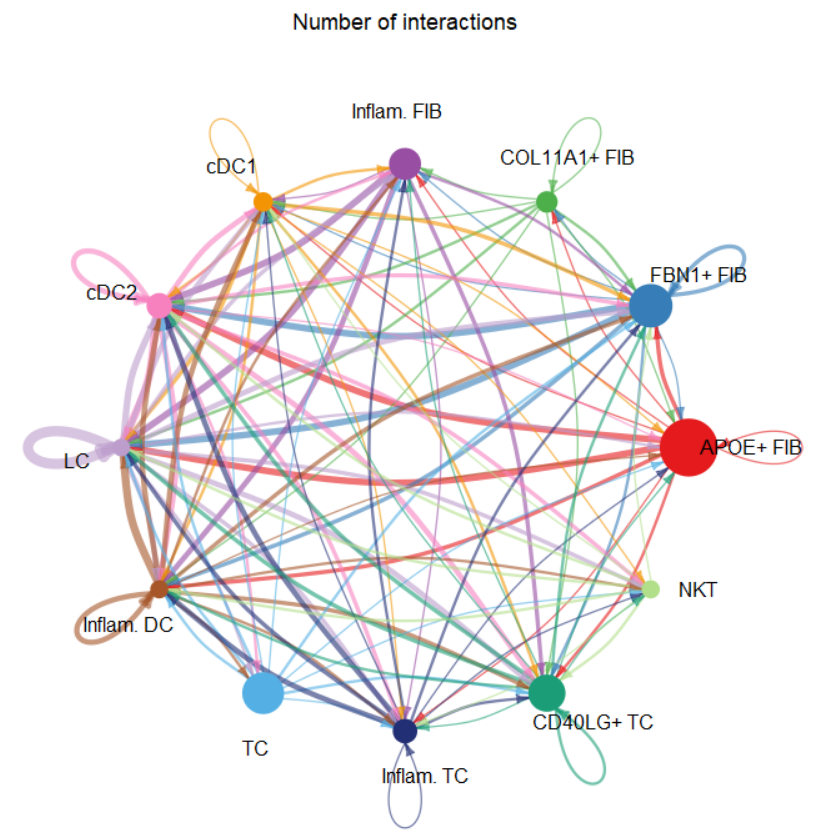
#如下线link的宽度与细胞群之间存在通讯配受体对数目成正比
netVisual_circle(cellchat@net$count, vertex.weight = groupSize, weight.scale = T,
                 label.edge= F, title.name = "Number of interactions")
#也可以设置为与通讯配受体对概率和成正比
#netVisual_circle(cellchat@net$weight, vertex.weight = groupSize, weight.scale = T,
#                 label.edge= F, title.name = "Interaction weights/strength")
|
1
2
3
4
5
6
|
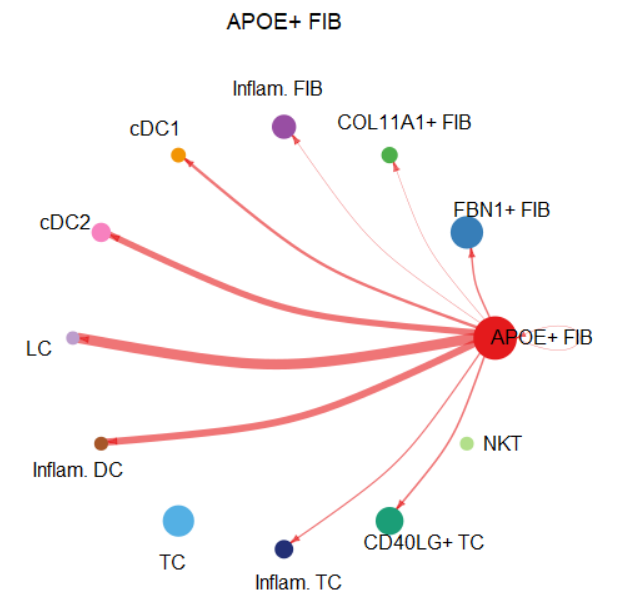
#如果只想关注某一类细胞群相关的通讯情况
mat <- cellchat@net$weight
mat2 <- matrix(0, nrow = nrow(mat), ncol = ncol(mat), dimnames = dimnames(mat))
mat2["APOE+ FIB", ] <- mat["APOE+ FIB", ]
netVisual_circle(mat2, vertex.weight = groupSize, weight.scale = T,
                 edge.weight.max = max(mat), title.name = "APOE+ FIB")
|
2.4.2 通路水平#
 1
 2
 3
 4
 5
 6
 7
 8
 9
10
11
12
13
14
15
16
17
18
|
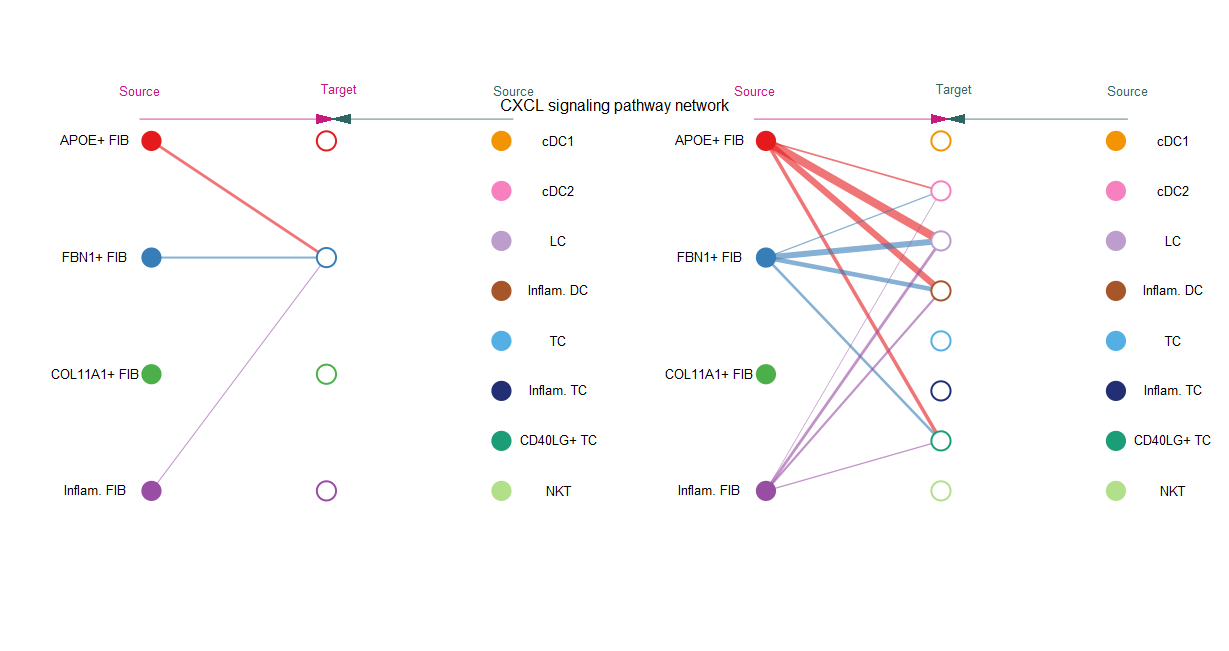
#(1)netVisual_aggregate()函数支持3种可视化布局,通过设置layout参数
pathways.show <- c("CXCL")
vertex.receiver = seq(1,3)
netVisual_aggregate(cellchat, signaling = pathways.show,
                    vertex.receiver = vertex.receiver,
                    layout = "hierarchy")
# netVisual_aggregate(cellchat, signaling = pathways.show,
#                     vertex.receiver = vertex.receiver,
#                     layout = "circle")
# netVisual_aggregate(cellchat, signaling = pathways.show,
#                     vertex.receiver = vertex.receiver,
#                     layout = "chord")

##如果使用第3中和弦图的可视化方式,那么可以再进一步指定细胞高层次的分组
# group.cellType <- c(rep("FIB", 4), rep("DC", 4), rep("TC", 4))
# names(group.cellType) <- levels(cellchat@idents)
# netVisual_chord_cell(cellchat, signaling = pathways.show, group = group.cellType,
#                      title.name = paste0(pathways.show, " signaling network"))
|
1
2
3
4
|
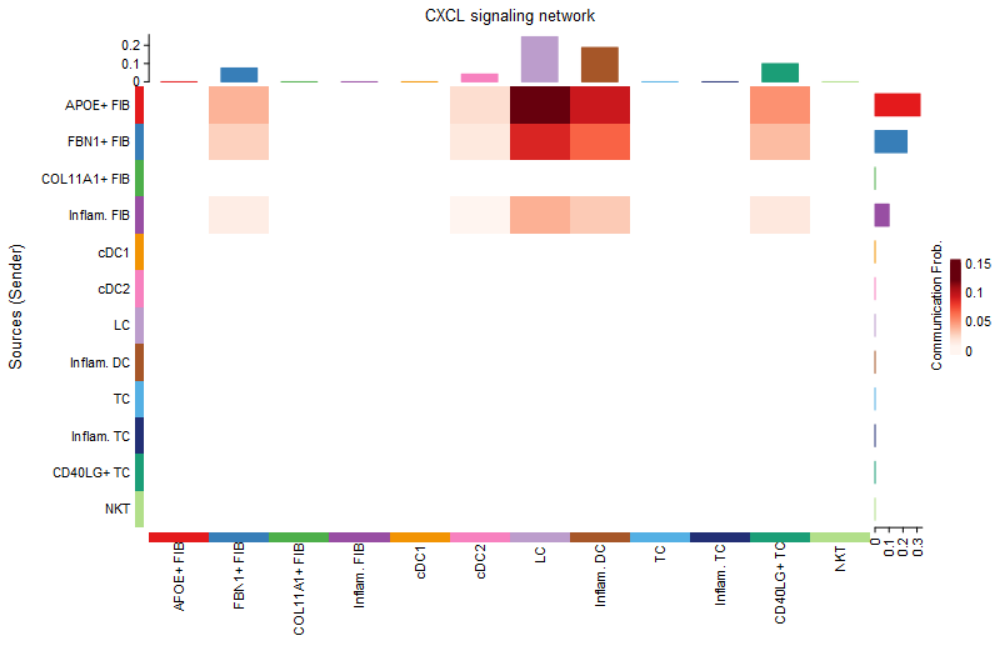
#(2) netVisual_heatmap()热图
##列表示Source,行表示Target
netVisual_heatmap(cellchat, signaling = pathways.show,
                  color.heatmap = "Reds")
|
2.4.3 配受体对水平#
1
2
3
4
5
6
7
8
9
|
## (1)通路与对应的配受体对
pairLR.CXCL <- extractEnrichedLR(cellchat, signaling = pathways.show,
                                 geneLR.return = FALSE)
#   interaction_name
# 1     CXCL12_CXCR4
# 2     CXCL12_ACKR3

## 可视化在通路的通讯水平中,哪些配受体的作用最大
netAnalysis_contribution(cellchat, signaling = pathways.show)
|
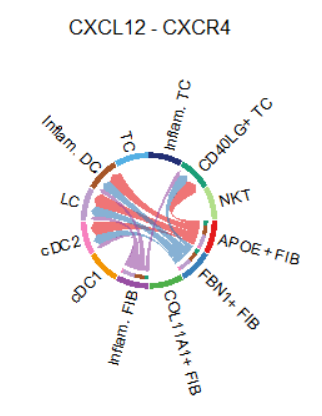
- 接下来选取
CXCL12_CXCR4配受体对进行可视化
 1
 2
 3
 4
 5
 6
 7
 8
 9
10
11
12
13
14
15
|
## (2)netVisual_individual()
LR.show <- 'CXCL12_CXCR4'
vertex.receiver = seq(1,2) # a numeric vector.
# netVisual_individual(cellchat, signaling = pathways.show,
#                     pairLR.use = LR.show,
#                     vertex.receiver = vertex.receiver,
#                     layout = "hierarchy")
# netVisual_individual(cellchat, signaling = pathways.show,
#                      pairLR.use = LR.show,
#                      vertex.receiver = vertex.receiver,
#                      layout = "circle")
netVisual_individual(cellchat, signaling = pathways.show,
                     pairLR.use = LR.show,
                     vertex.receiver = vertex.receiver,
                     layout = "chord")
|
1
2
3
4
5
6
7
8
|
## (3)netVisual_bubble()气泡图
##有点类似的Seurat的dotplot()
netVisual_bubble(cellchat, sources.use = 4, targets.use = c(5:11),
                 remove.isolate = FALSE)
# #指定通路所包含的配受体
# pairLR.use <- extractEnrichedLR(cellchat, signaling = c("CCL","CXCL","FGF"))
# netVisual_bubble(cellchat, sources.use = c(3,4), targets.use = c(5:8),
#                  pairLR.use = pairLR.use, remove.isolate = TRUE)
|
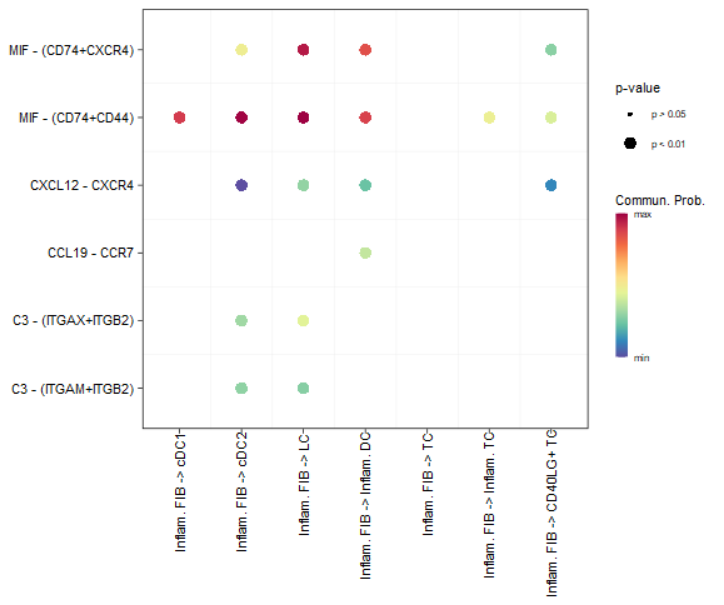
此外 netVisual_chord_gene()函数支持通路、配受体水平的细胞群通讯和弦图可视化;plotGeneExpression()通路涉及基因在不同细胞群的表达情况可视化,就不展示了。
2.5 基于配受体通讯的衍生分析2#
2.5.1 鉴别senders, receivers等#
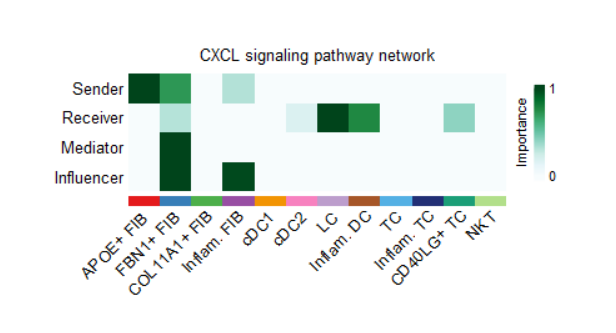
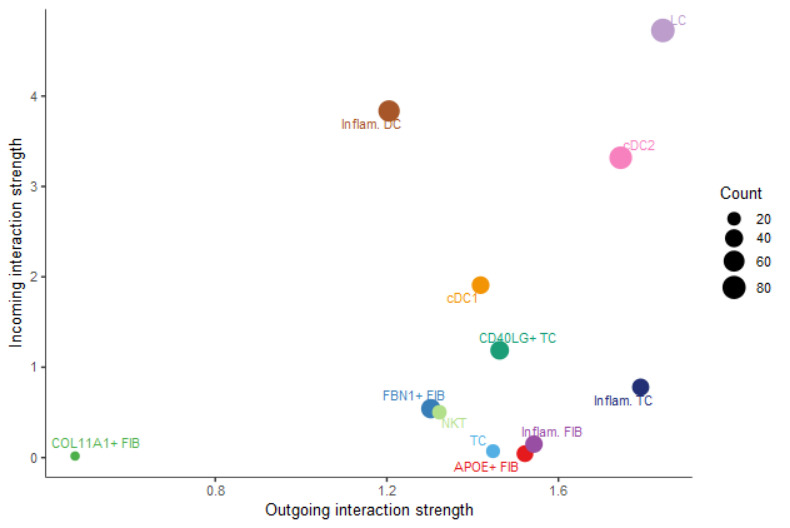
将细胞群作为节点,细胞群的配受体/通路通讯关系作为有方向、有权重的边则构建了一个细胞通讯网络
- 根据节点的出度(out-degree)和,分析细胞群是否为dominant senders
- 根据节点的入度(in-degree)和,分析细胞群是否为dominant receivers
- 根据节点的betweenness,centrality 等,计算细胞群是否为重要的dominant mediator、influencer
1
2
3
4
5
|
cellchat <- netAnalysis_computeCentrality(cellchat, slot.name = "netP")
cellchat@netP$centr %>% names()
#(1)概括图
netAnalysis_signalingRole_network(cellchat, signaling = pathways.show,
                                  width = 8, height = 2.5, font.size = 10)
|
1
2
3
4
5
|
#(2)重点可视化senders, receivers的关系
##all signaling pathways
netAnalysis_signalingRole_scatter(cellchat)
##也可以指定通路
## netAnalysis_signalingRole_scatter(cellchat, signaling = c("CXCL", "CCL"))
|
1
2
3
4
5
|
#(3)所有通路在所有细胞群的出入度可视化
## which signals contributing most to outgoing  signaling of certain cell groups.
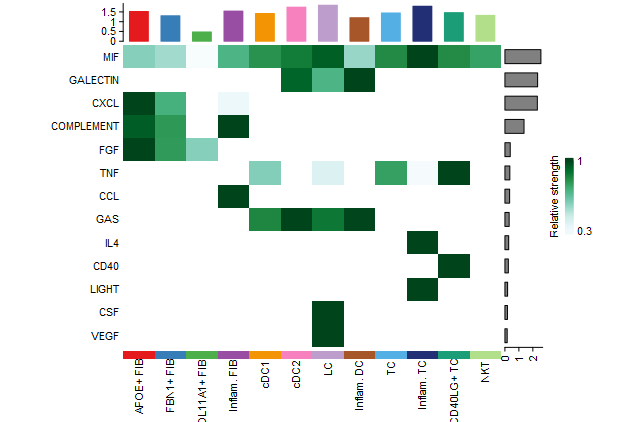
netAnalysis_signalingRole_heatmap(cellchat, pattern = "outgoing")
# ## which signals contributing most to incoming signaling of certain cell groups.
# netAnalysis_signalingRole_heatmap(cellchat, pattern = "incoming")
|
2.5.2 模式识别NMF#
- 关于NMF非负矩阵分解:将原始矩阵分解为两个非负的子矩阵,分别称之为系数矩阵与基矩阵;可以结合Bulk RNAseq表达矩阵分解出样本的细胞类型比例组成理解。
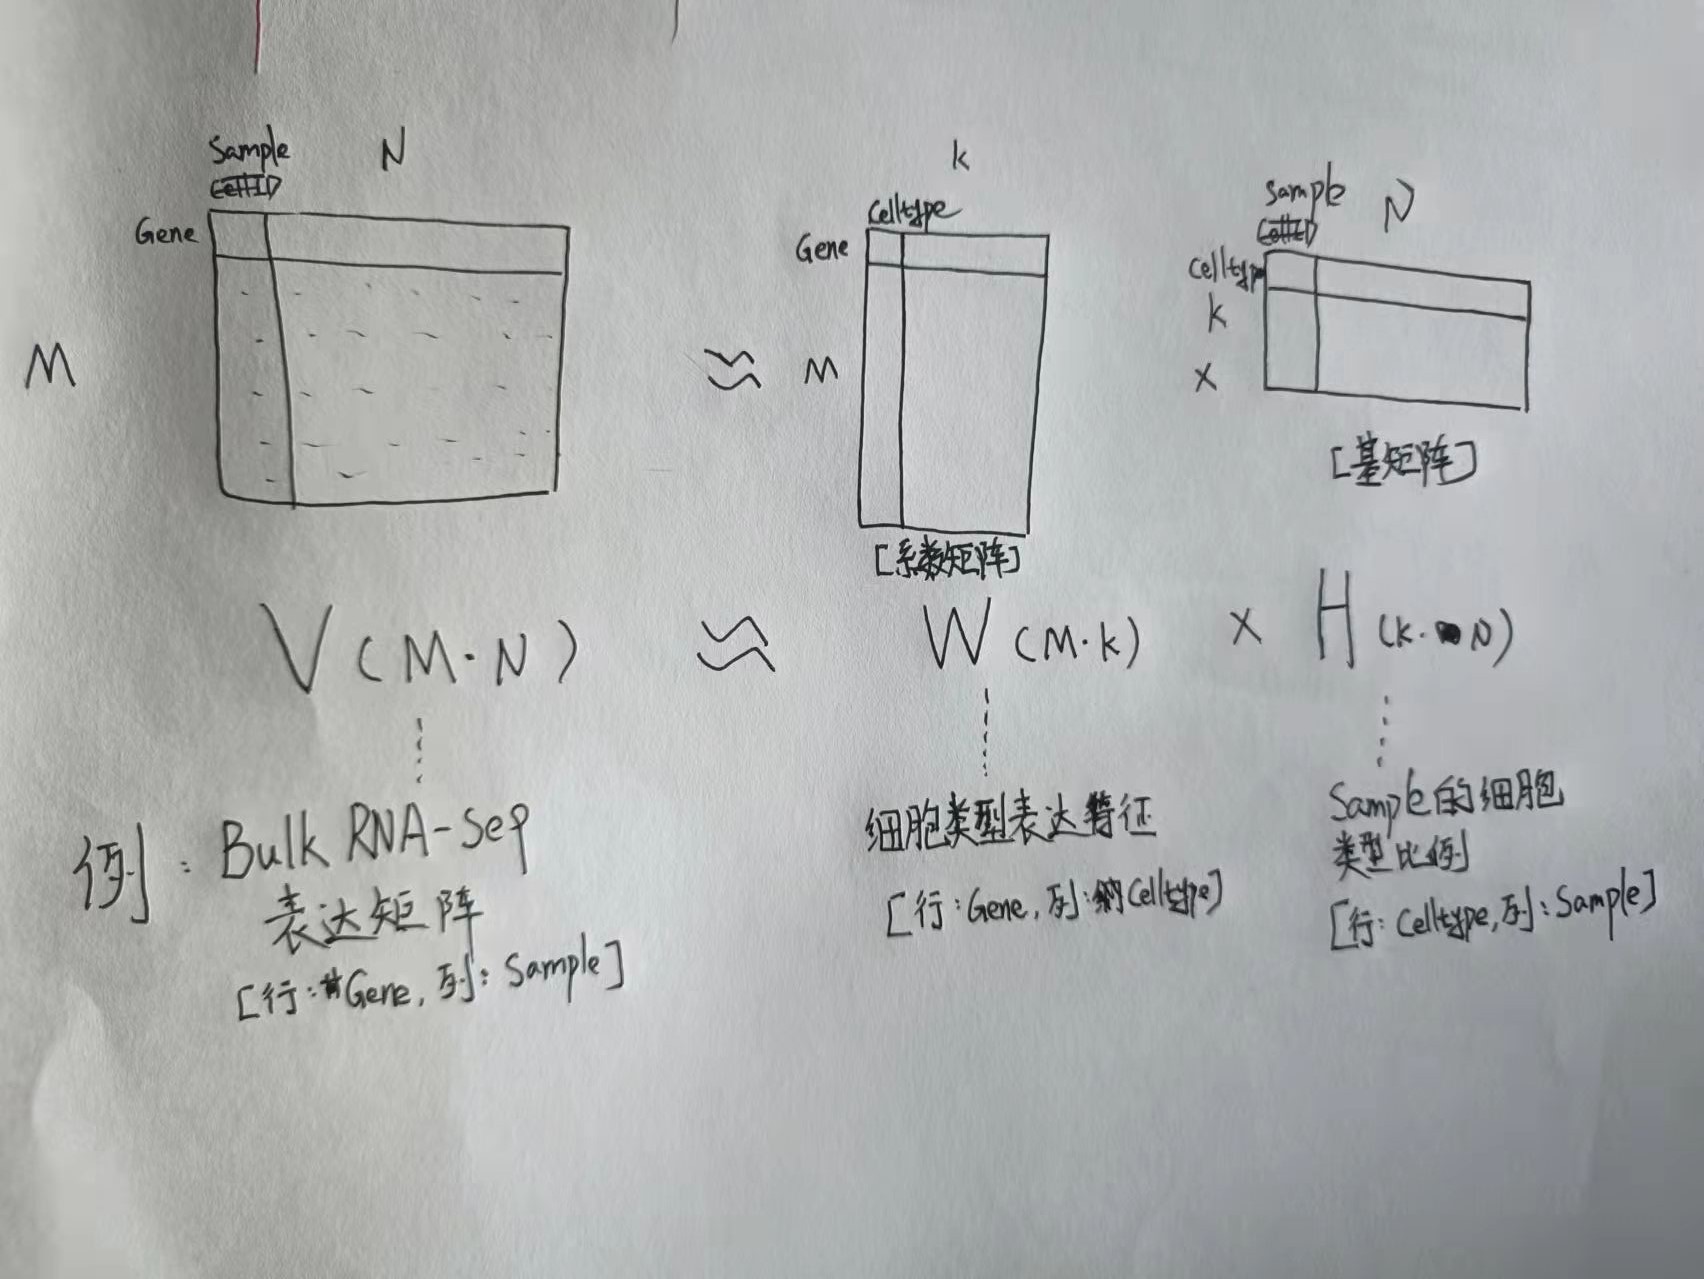
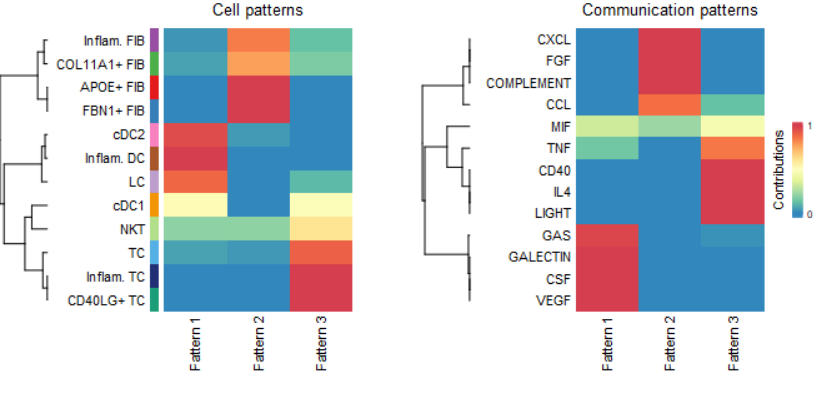
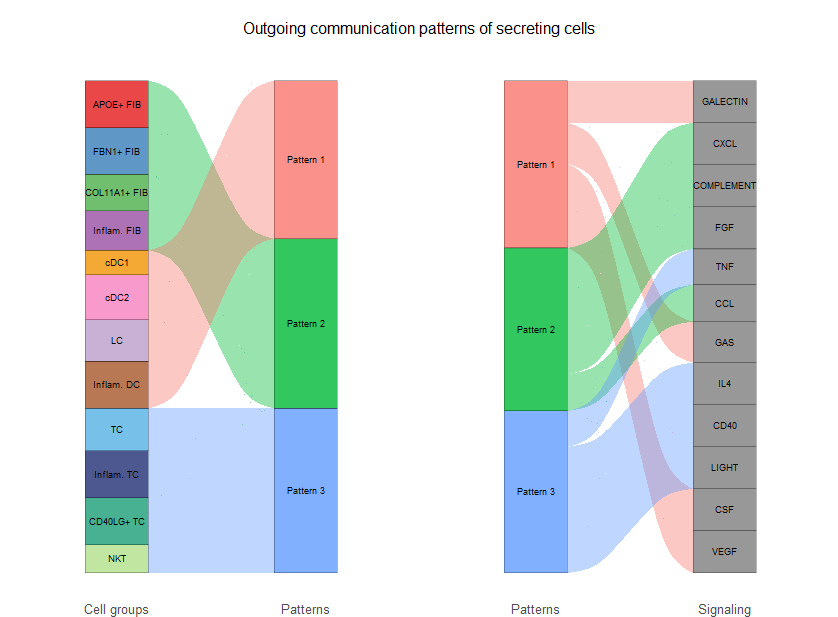
- 在这一步,试分析:哪些通路类似从而属于同一个模式(Pattern),这些模式主要在哪些细胞类型中高表达。
1
2
3
4
5
|
library(NMF)
library(ggalluvial)
selectK(cellchat, pattern = "outgoing") #time consuming
#根据上述结果,提示可能有3个潜在的Pattern
cellchat <- identifyCommunicationPatterns(cellchat, pattern = "outgoing", k = 3)
|
1
2
|
#桑基图
netAnalysis_river(cellchat, pattern = "outgoing")
|
(1) netAnalysis_dot() 可对每个细胞群的出度和进行dotplot可视化
(2) 以上是对出度out-degree的分析,同理也可以对入度in-degree进行同样的分析。
3、两个数据集的细胞通讯比较#
- 对来自两种不同生物状态(如对照组与疾病组)的细胞通讯比较分析;
- 首先需要对每种数据分别跑一遍上述的单细胞数据集细胞通讯分析流程,得到相应的CellChat对象。然后整合,就可以开始比较分析
 1
 2
 3
 4
 5
 6
 7
 8
 9
10
11
12
13
14
15
16
17
|
library(CellChat)
library(patchwork)
cellchat.NL <- readRDS(url("https://ndownloader.figshare.com/files/25954199"))
cellchat.LS <- readRDS(url("https://ndownloader.figshare.com/files/25956518"))
cellchat.NL #17328 2552
cellchat.LS #17328 5011
object.list <- list(NL = cellchat.NL, LS = cellchat.LS)
names(object.list)
# [1] "NL" "LS"
cellchat <- mergeCellChat(object.list, add.names = names(object.list))

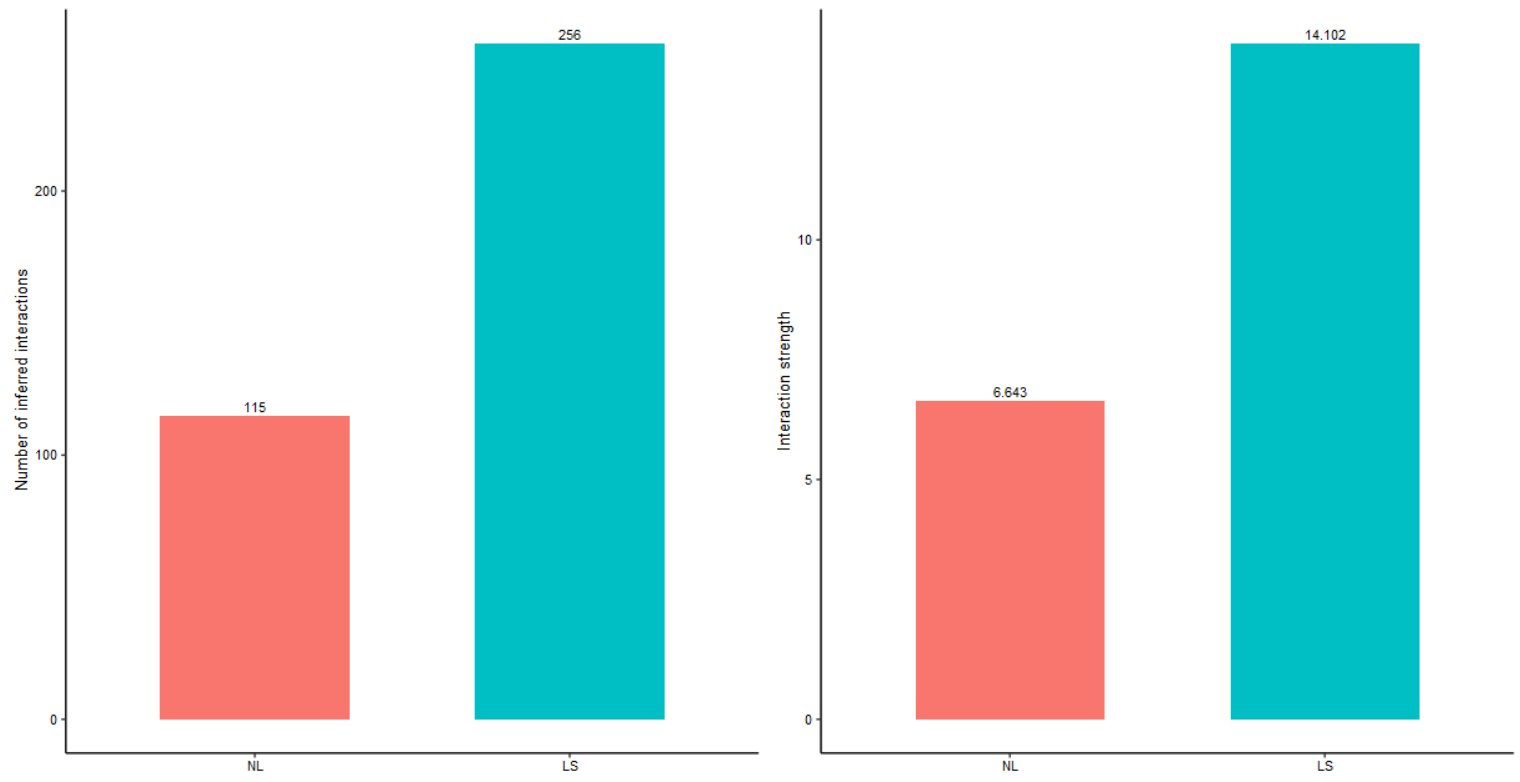
#先大致看一下不同生物状态的细胞通讯(数量与强度)差异
#the total number of interactions
gg1 <- compareInteractions(cellchat, show.legend = F, group = c(1,2))
#the total interaction strength
gg2 <- compareInteractions(cellchat, show.legend = F, group = c(1,2), measure = "weight")
gg1 + gg2
|
3.1 细胞群水平#
1
2
3
4
5
6
|
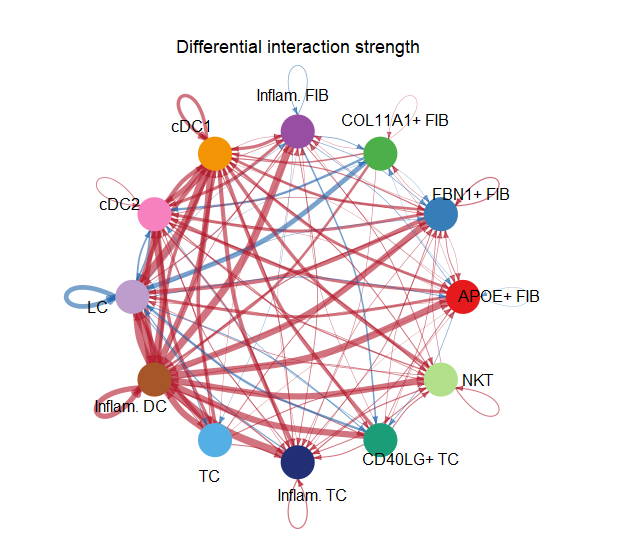
#(1) netVisual_diffInteraction()弦图
## 红色表示第二个数据与第一个数据增强,蓝色则表示降低
## measure = "count" 数目差异
netVisual_diffInteraction(cellchat, weight.scale = T, measure = "count")
# ## measure = "weight" 强度差异
# netVisual_diffInteraction(cellchat, weight.scale = T, measure = "weight")
|
1
2
3
4
5
|
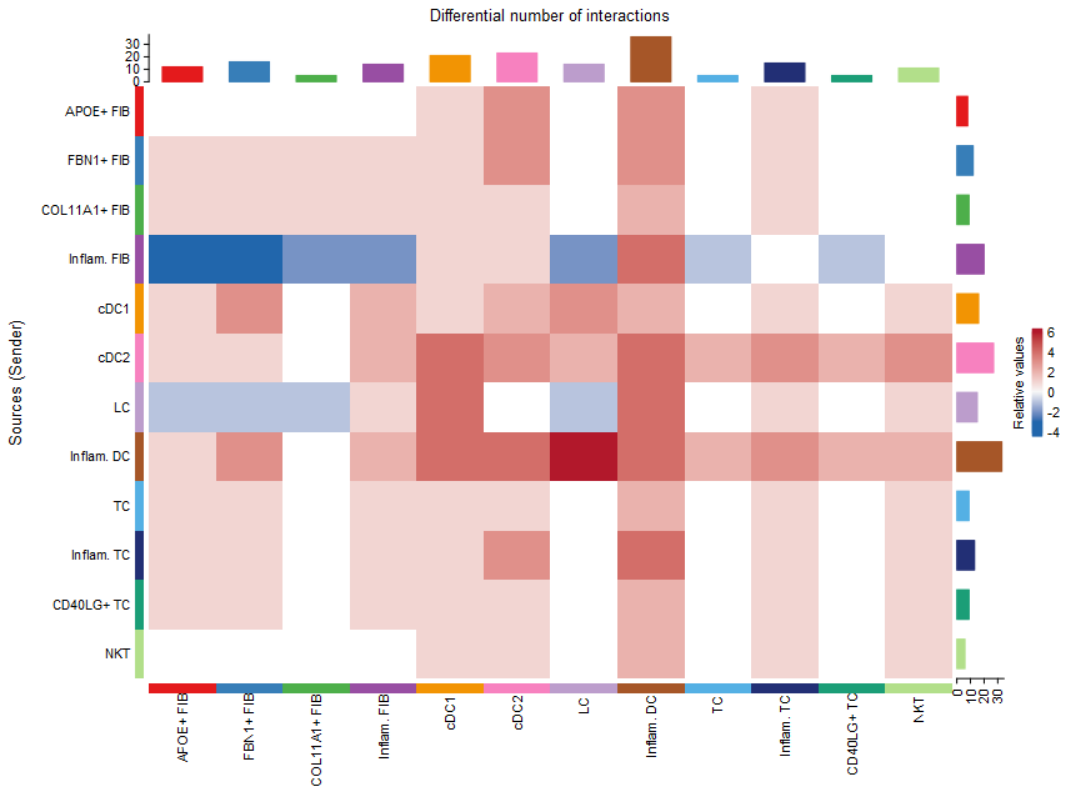
#(2) netVisual_heatmap()热图
#列代表作为source与其它其它细胞类型的差异
#列代表作为target与其它其它细胞类型的差异
netVisual_heatmap(cellchat, measure = "count")
#netVisual_heatmap(cellchat, measure = "weight")
|
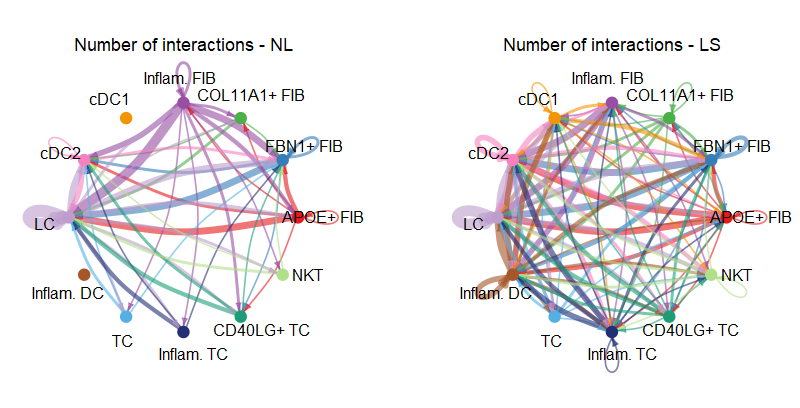
这种可视化是控制表示大小的映射(线宽等)在两个数据集的比例尺相同
1
2
3
4
5
6
7
8
|
#(1) netVisual_circle 弦图
weight.max <- getMaxWeight(object.list, attribute = c("idents","count"))
par(mfrow = c(1,2), xpd=TRUE)
for (i in 1:length(object.list)) {
  netVisual_circle(object.list[[i]]@net$count, weight.scale = T, label.edge= F,
                   edge.weight.max = weight.max[2], edge.width.max = 12,
                   title.name = paste0("Number of interactions - ", names(object.list)[i]))
}
|
 1
 2
 3
 4
 5
 6
 7
 8
 9
10
11
12
13
|
# #简化细胞类型
# weight.max <- getMaxWeight(object.list, slot.name = c("idents", "net", "net"),
#                            attribute = c("idents","count", "count.merged"))
# par(mfrow = c(1,2), xpd=TRUE)
# for (i in 1:length(object.list)) {
#   netVisual_circle(object.list[[i]]@net$count.merged, weight.scale = T, label.edge= T,
#                    edge.weight.max = weight.max[3], edge.width.max = 12,
#                    title.name = paste0("Number of interactions - ", names(object.list)[i]))
# }

# par(mfrow = c(1,2), xpd=TRUE)
# netVisual_diffInteraction(cellchat, weight.scale = T, measure = "count.merged", label.edge = T)
# netVisual_diffInteraction(cellchat, weight.scale = T, measure = "weight.merged", label.edge = T)
|
 1
 2
 3
 4
 5
 6
 7
 8
 9
10
11
12
13
14
15
16
|
#(2) netAnalysis_signalingRole_scatter()
## 比较两组Incoming与Outgoing差异
num.link <- sapply(object.list, function(x) {
  #细胞群所参与的所有配受体对数目
  rowSums(x@net$count) + colSums(x@net$count)-diag(x@net$count)
  }
)
# control the dot size in the different datasets
weight.MinMax <- c(min(num.link), max(num.link))
gg <- list()
for (i in 1:length(object.list)) {
  gg[[i]] <- netAnalysis_signalingRole_scatter(object.list[[i]],
                                               title = names(object.list)[i],
                                               weight.MinMax = weight.MinMax)
}
patchwork::wrap_plots(plots = gg)
|
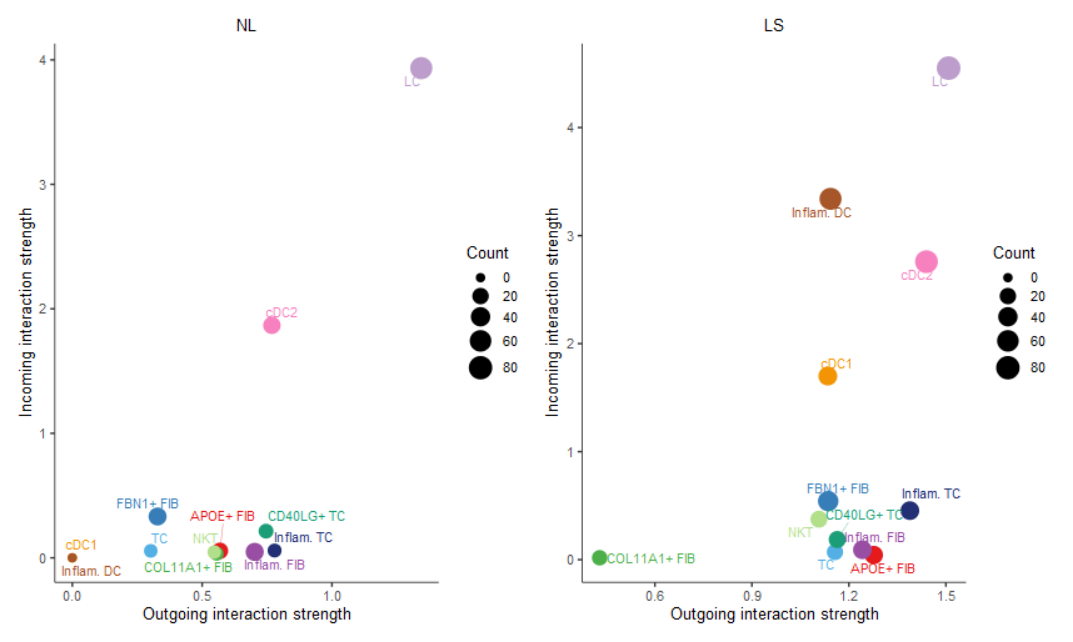
3.2 通路水平#
1
2
3
|
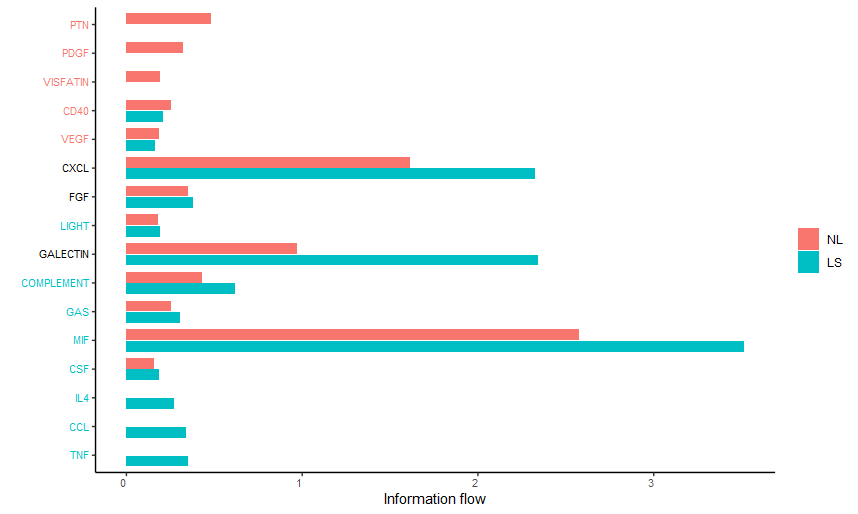
#(1) 总结通路在不同生物状态总体的对比差异
rankNet(cellchat, mode = "comparison", stacked = F, do.stat = TRUE)
# rankNet(cellchat, mode = "comparison", stacked = T, do.stat = TRUE)
|
 1
 2
 3
 4
 5
 6
 7
 8
 9
10
|
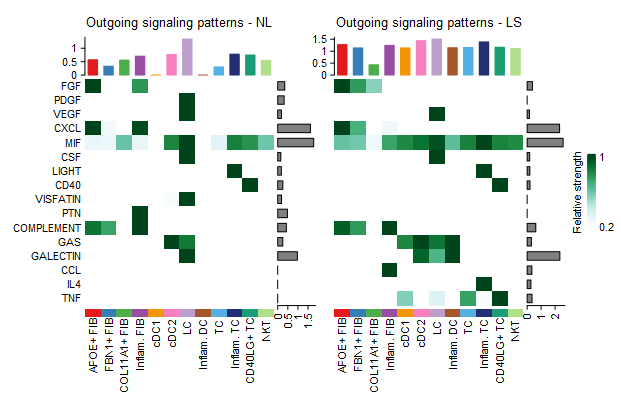
#(1) 总结通路在不同生物状态的不同细胞群之间的对比差异
library(ComplexHeatmap)
i = 1
#取全集通路
pathway.union <- union(object.list[[i]]@netP$pathways, object.list[[i+1]]@netP$pathways)
ht1 = netAnalysis_signalingRole_heatmap(object.list[[i]], pattern = "outgoing", signaling = pathway.union, title = names(object.list)[i], width = 5, height = 6)
ht2 = netAnalysis_signalingRole_heatmap(object.list[[i+1]], pattern = "outgoing", signaling = pathway.union, title = names(object.list)[i+1], width = 5, height = 6)
draw(ht1 + ht2, ht_gap = unit(0.5, "cm"))
#pattern参数可以是下面三选一
#pattern = c("outgoing", "incoming", "all")
|
 1
 2
 3
 4
 5
 6
 7
 8
 9
10
11
12
|
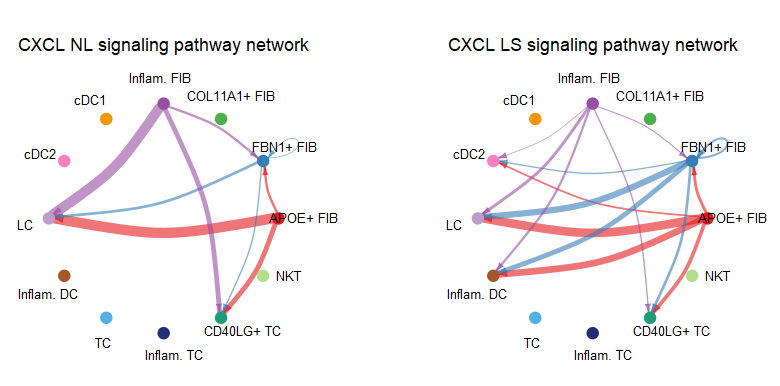
#(2) 基于某一特定通路的对比比较 netVisual_aggregate()
pathways.show <- c("CXCL")
weight.max <- getMaxWeight(object.list, slot.name = c("netP"),
                           attribute = pathways.show)
par(mfrow = c(1,2), xpd=TRUE)
for (i in 1:length(object.list)) {
  netVisual_aggregate(object.list[[i]], signaling = pathways.show,
                      layout = "circle", edge.weight.max = weight.max[1],
                      edge.width.max = 10,
                      signaling.name = paste(pathways.show, names(object.list)[i]))
}
#layout = c("circle", "hierarchy", "chord")
|
此外 netVisual_heatmap()支持热图的可视化方式
3.3 配受体水平#
1
2
3
4
|
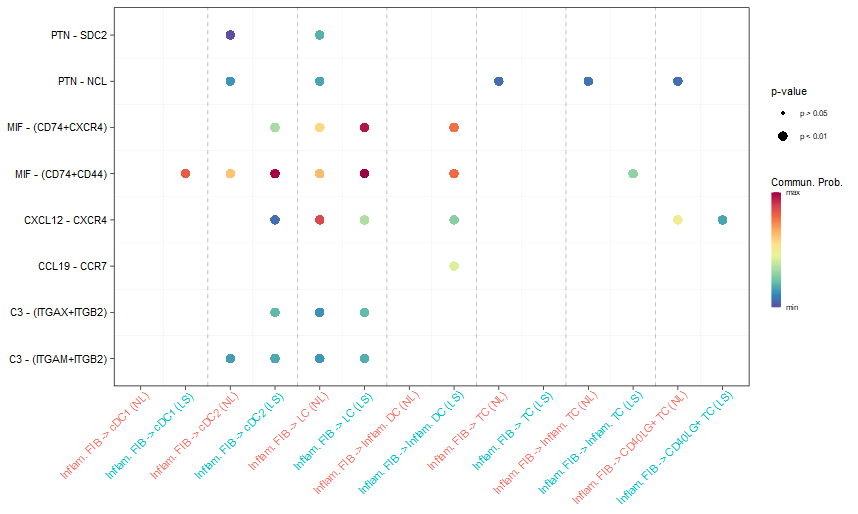
#(1) netVisual_bubble()
##直接基于两个CellChat所计算的通讯差异的结果
netVisual_bubble(cellchat, sources.use = 4, targets.use = c(5:11),
                 comparison = c(1, 2), angle.x = 45)
|
 1
 2
 3
 4
 5
 6
 7
 8
 9
10
11
|
# #在LS中高表达的配受体
# gg1 <- netVisual_bubble(cellchat, sources.use = 4, targets.use = c(5:11),
#                         comparison = c(1, 2), max.dataset = 2,
#                         title.name = "Increased signaling in LS",
#                         angle.x = 45, remove.isolate = T)
# #在LS中低表达的配受体
# gg2<- netVisual_bubble(cellchat, sources.use = 4, targets.use = c(5:11),
#                         comparison = c(1, 2), max.dataset = 1,
#                         title.name = "Decreased signaling in LS",
#                         angle.x = 45, remove.isolate = T)
# gg1 + gg2
|
 1
 2
 3
 4
 5
 6
 7
 8
 9
10
11
12
13
14
15
16
17
18
19
|
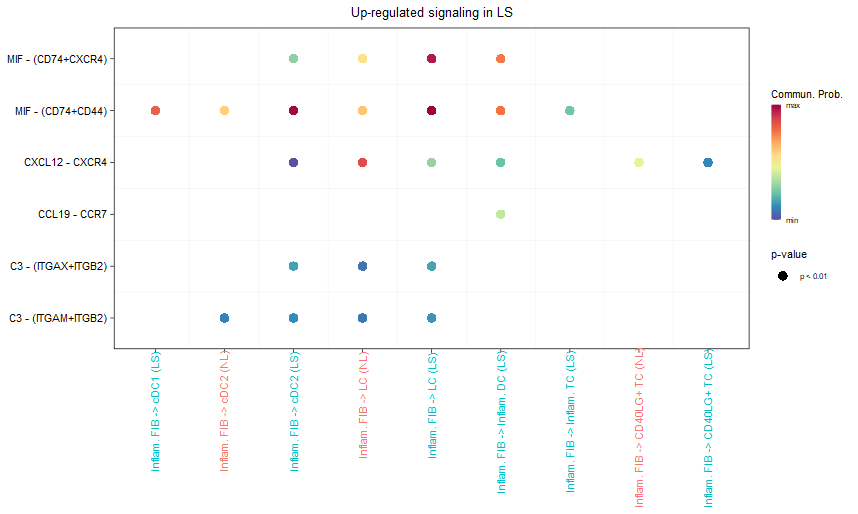
#(2) 基于最底层的不同状态下差异基因的配受体差异分析
pos.dataset = "LS"
features.name = pos.dataset
cellchat <- identifyOverExpressedGenes(cellchat, group.dataset = "datasets",
                                       pos.dataset = pos.dataset, features.name = features.name,
                                       only.pos = FALSE, thresh.pc = 0.1, thresh.fc = 0.1, thresh.p = 1)
net <- netMappingDEG(cellchat, features.name = features.name)
net.up <- subsetCommunication(cellchat, net = net, datasets = "LS",
                              ligand.logFC = 0.2, receptor.logFC = NULL)
head(net.up,2)
pairLR.use.up = net.up[, "interaction_name", drop = F]
netVisual_bubble(cellchat, pairLR.use = pairLR.use.up,
                 sources.use = 4, targets.use = c(5:11),
                 comparison = c(1, 2),  angle.x = 90, remove.isolate = T,
                 title.name = paste0("Up-regulated signaling in ", names(object.list)[2]))

#同理也是可以可视化下调的配受体对
net.down <- subsetCommunication(cellchat, net = net, datasets = "NL",
                                ligand.logFC = -0.1, receptor.logFC = -0.1)
|
