参考

 1
 2
 3
 4
 5
 6
 7
 8
 9
10
11
12
import numpy as np
import pandas as pd
import matplotlib.pyplot as plt
import seaborn as sns
# Box plots -- sns.boxplot()
# Bar plots -- sns.barplot()
# Swarm plots -- sns.swarmplot()
# Strip plots -- sns.stripplot()
# Violin plots -- sns.violinplot()
# Supporting FacetGrid -- sns.catplot(col=..., row=...)

from statannotations.Annotator import Annotator

1. Basic use

 1
 2
 3
 4
 5
 6
 7
 8
 9
10
11
x = "day"
y = "total_bill"
order = ['Sun', 'Thur', 'Fri', 'Sat']
ax = sns.boxplot(data=df, x=x, y=y, order=order)

pairs = [("Thur", "Fri"), ("Thur", "Sat"), ("Fri", "Sun")]
annot = Annotator(ax, pairs, data=df, x=x, y=y, order=order)
annot.configure(test='t-test_ind', text_format='star', loc='outside', verbose=2)
# annot.apply_test()
# ax, test_results = annot.annotate()
ax, test_results = annot.apply_and_annotate()

Tips: sns.plot的data, x, y, order等绘图参数需要与Annotator的保持一致。

image-20250714225228275
1
2
# 整合统计结果
pd.concat([pd.DataFrame(test_result.data.__dict__) for test_result in test_results])

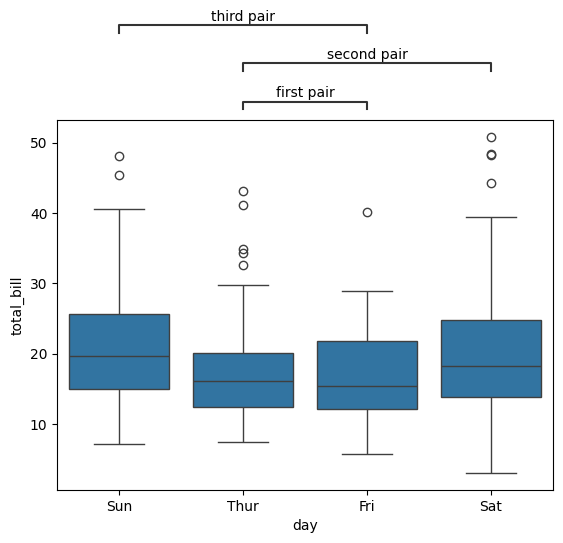
2. Annotator pairs参数设置

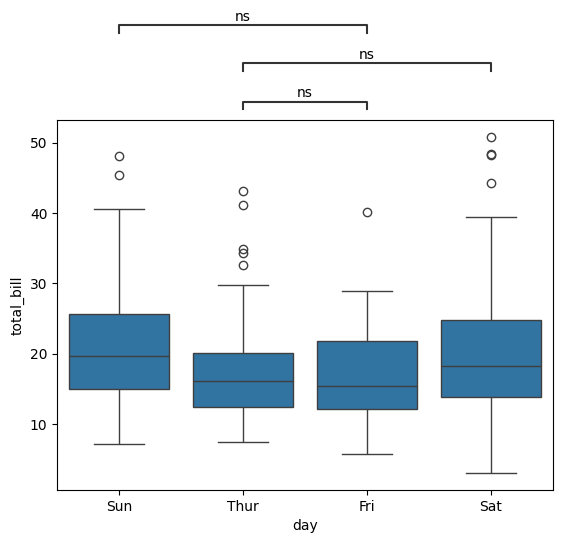
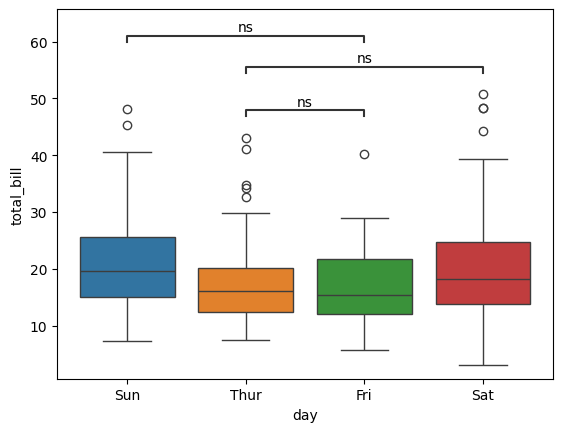
  • 简单的两两比较:对应sns plot的x轴,e.g. [("A", "B"), ("A", "C")],

  • 两个分组列情况:主分组对应sns plot的x轴,子分组对应hue列 e.g. [(("A", "x"), ("A", "y")), (("B", "x"), ("B", "y"))]

 1
 2
 3
 4
 5
 6
 7
 8
 9
10
11
12
13
14
15
16
17
18
19
20
21
22
23
24
25
26
# 示例数据
df_class = pd.DataFrame({
    "class": ["A", "A", "B", "B", "C", "C"] * 5,  # 多次重复模拟多样本
    "gender": ["Male", "Female"] * 3 * 5,
    "score": np.random.normal(size=6*5)
})

plt.figure(figsize=(8, 6))
ax = sns.boxplot(data=df_class, x="class", y="score", hue="gender", 
                 order=["A", "B", "C"], hue_order=["Female", "Male"])

# 定义 pairs(注意此时是 tuple of tuples)
pairs = [
    (("A", "Male"), ("A", "Female")),
    (("B", "Male"), ("B", "Female")),
    (("C", "Male"), ("C", "Female")),
]

annotator = Annotator(ax, pairs, data=df_class, x="class", y="score", hue="gender", 
                      order=["A", "B", "C"], hue_order=["Female", "Male"])
annotator.configure(test='t-test_ind', text_format='star', loc='inside')
annotator.apply_and_annotate()

plt.legend(title="Gender", bbox_to_anchor=(1.05, 1), loc='upper left')
plt.tight_layout()
plt.show()

3. Configure 检验以及校正方法

1) configure test param can be

  • t-test_ind 两组独立样本,正态分布
  • t-test_paired 两组配对样本,正态分布
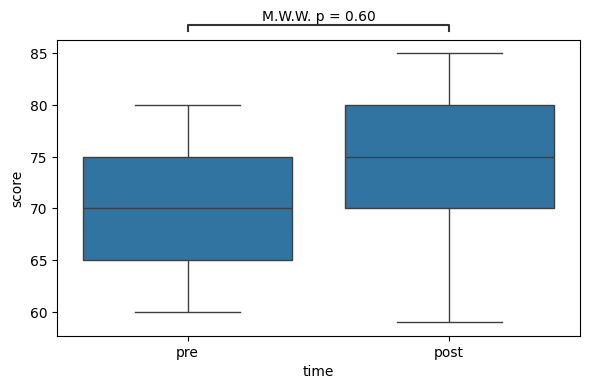
  • Mann-Whitney 两组独立样本,非正态分布
  • Mann-Whitney-gt 前组是否显著大于后组
  • Mann-Whitney-ls 前组是否显著小于后组
  • Wilcoxon 两组配对样本,非正态分布
  • Kruskal 方差分析

2) configure comparisons_correction param can be

  • ‘bonferroni’, ‘bonf’, ‘Bonferroni’,
  • ‘holm-bonferroni’, ‘HB’, ‘Holm-Bonferroni’, ‘holm’
  • ‘benjamini-hochberg’, ‘BH’, ‘fdr_bh’, ‘Benjamini-Hochberg’
  • ‘fdr_by’, ‘Benjamini-Yekutieli’, ‘BY’
 1
 2
 3
 4
 5
 6
 7
 8
 9
10
x = "day"
y = "total_bill"
order = ['Sun', 'Thur', 'Fri', 'Sat']
ax = sns.boxplot(data=df, x=x, y=y, hue=x, order=order, hue_order=order)

annot = Annotator(ax, [("Thur", "Fri"), ("Thur", "Sat"), ("Fri", "Sun")], data=df, x=x, y=y, order=order)
annot.configure(test='Mann-Whitney', text_format='star', loc='inside', verbose=2, comparisons_correction="HB", correction_format = "replace")
# annot.apply_test()
# ax, test_results = annot.annotate()
ax, test_results = annot.apply_and_annotate()
image-20250714225930732

3) 关于配对检验的数据:需要使得每个分组的配对样本的顺序保持一致
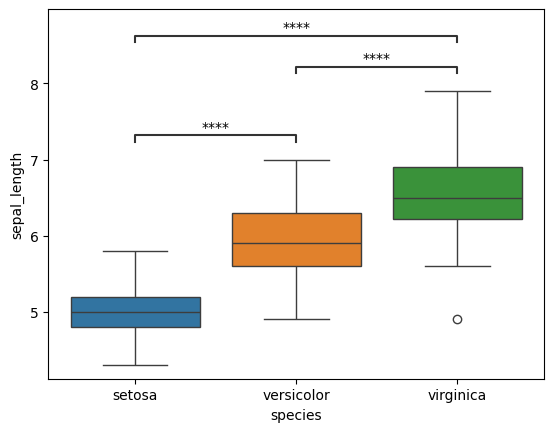
 1
 2
 3
 4
 5
 6
 7
 8
 9
10
11
12
13
14
15
16
17
18
19
20
21
22
23
24
25
26
27
28
29
df_st = pd.DataFrame({
    "student_id": [1, 2, 3, 4, 5] * 2,
    "time": ["pre"] * 5 + ["post"] * 5,
    "score": [70, 65, 80, 75, 60, 75, 70, 85, 80, 59]
})

# 如果打乱行的顺序,配对信息会错乱
shuffled_df_st = df_st.sample(frac=1, random_state=42)

plt.figure(figsize=(6, 4))
# ax = sns.boxplot(data=df_st, x="time", y="score")
ax = sns.boxplot(data=df_st, x="time", y="score", order=["pre", "post"])

# 设置配对比较(使用方式没什么区别,就是要注意行的顺序保持一致)
pairs = [("pre", "post")]
annot = Annotator(ax, pairs, data=df_st, x="time", y="score", order=["pre", "post"])
annot.configure(
    # test='t-test_paired',
    test='Mann-Whitney',
    # test='t-test_ind',
    text_format='simple',
    # text_format='star',
    show_test_name=True,
    loc='outside'
)
annot.apply_and_annotate()

plt.tight_layout()
plt.show()
image-20250714225914126

4. 显著性显示格式

1) configure text_format param can be

  • “star”: 显示为星号
  • “simple”: e.g. p≤0.05 [可进一步设置 show_test_name=True/False]
  • “full”: e.g. p=0.02 [同上]

2) configure pvalue_format param

  • 当 text_format = “star"时, 默认为
1
[[1e-4, "****"], [1e-3, "***"], [1e-2, "**"], [0.05, "*"], [1, "ns"]]
  • 当 text_format = “simple"时, 默认为-
1
[[1e-5, "1e-5"], [1e-4, "1e-4"], [1e-3, "0.001"], [1e-2, "0.01"], [5e-2, "0.05"]]

3) set_custom_annotations() 自定义标注的文本内容,而不作检验

1
2
3
4
5
6
7
8
9
x = "day"
y = "total_bill"
order = ['Sun', 'Thur', 'Fri', 'Sat']
ax = sns.boxplot(data=df, x=x, y=y, order=order)

annot = Annotator(ax, [("Thur", "Fri"), ("Thur", "Sat"), ("Fri", "Sun")], data=df, x=x, y=y, order=order)
annot.configure(loc='outside', verbose=0)
annot.set_custom_annotations(["first pair", "second pair", "third pair"])
ax, test_results = annot.annotate()
image-20250714230046138

5. 自定义检验方式

 1
 2
 3
 4
 5
 6
 7
 8
 9
10
11
12
13
14
15
16
17
18
19
20
21
22
23
24
25
26
27
28
from statannotations.stats.StatTest import StatTest
import numpy as np
from scipy.stats import ttest_ind

# Any function that follows the StatTest API could go here
def log_ttest(group_data1, group_data2, **stats_params):
    group_data1_log = np.log(group_data1)
    group_data2_log = np.log(group_data2)

    return ttest_ind(group_data1_log, group_data2_log, **stats_params)

df_iris = sns.load_dataset("iris")
x = "species"
y = "sepal_length"

pairs = [("setosa", "versicolor"), ("setosa", "virginica"), ("versicolor", "virginica")]

# Required descriptors for annotate [设置单侧检验]
custom_long_name = 'Log t-test-ls'
custom_short_name = 'log-t-ls'
custom_func = log_ttest
custom_test = StatTest(custom_func, custom_long_name, custom_short_name, alternative="less")

# Then, same as usual
ax = sns.boxplot(data=df_iris, x=x, y=y, hue=x)
annot = Annotator(ax, pairs, data=df_iris, x=x, y=y, hue=x)
ax, test_results = annot.configure(test=custom_test, comparisons_correction=None,
                text_format='star').apply_test().annotate()
image-20250715082904022

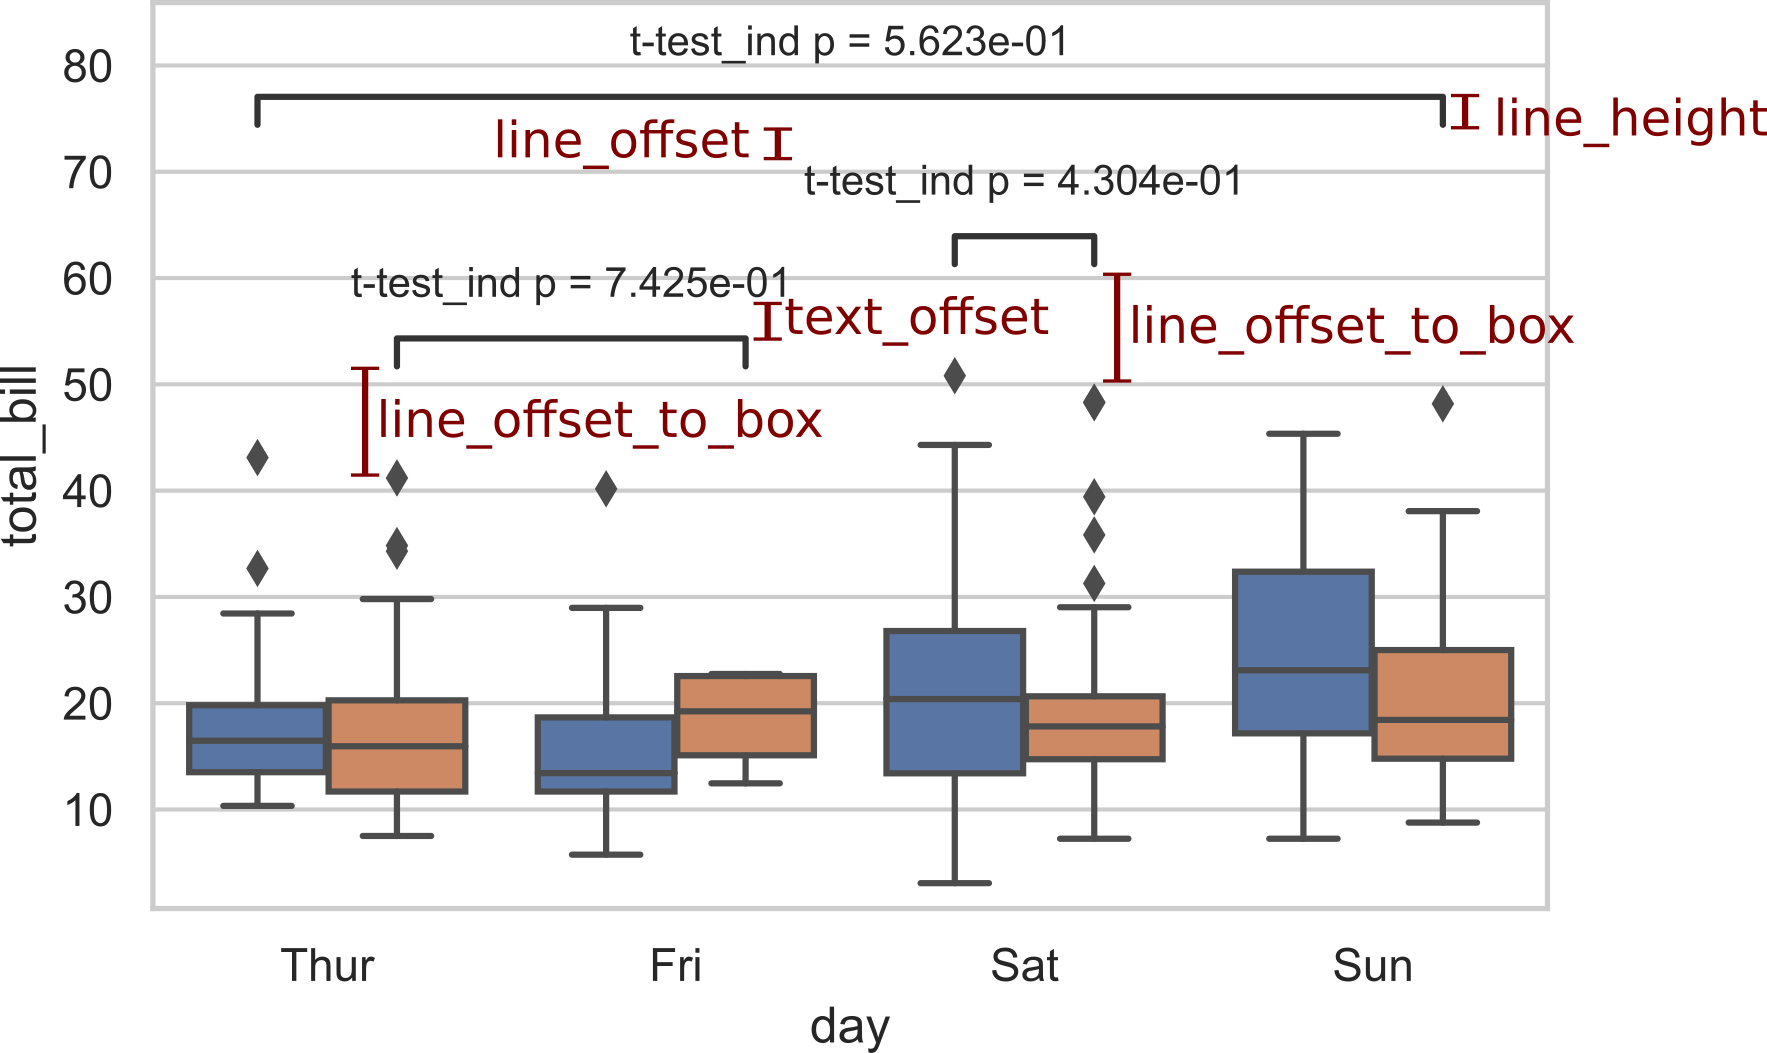
最后还可以调整标线line等元素的外观展示,效果。具体示例可以参考开头引用的example.ipynb

img